The Reservoir
Essays on water-data transparency
Behind-the-scenes notes, methodology deep-dives, country case studies, and observations from building the world's first systematic ranking of reservoir-data openness.
Featured
Introducing the Reservoir Transparency Index: H1 2026
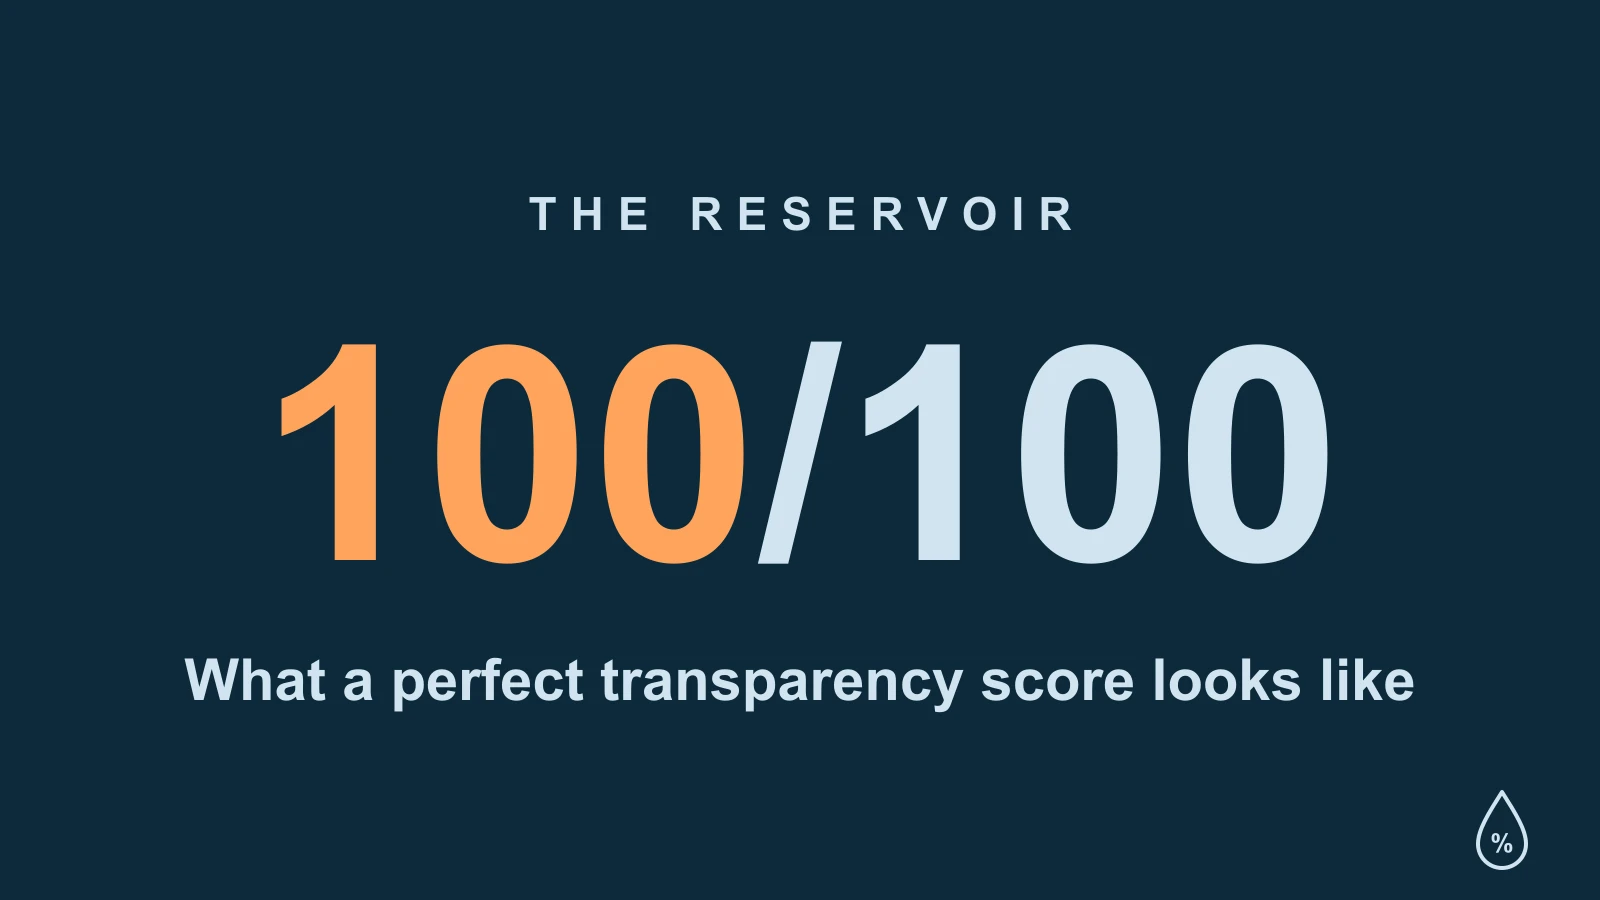
The inaugural, semi-annual ranking of how openly countries publish their reservoir storage data. The H1 2026 edition evaluated 194 countries — and the median one scores F.
US Drought Monitor, July 2026: 38% of the Country Is in Drought — and What the Reservoirs Add
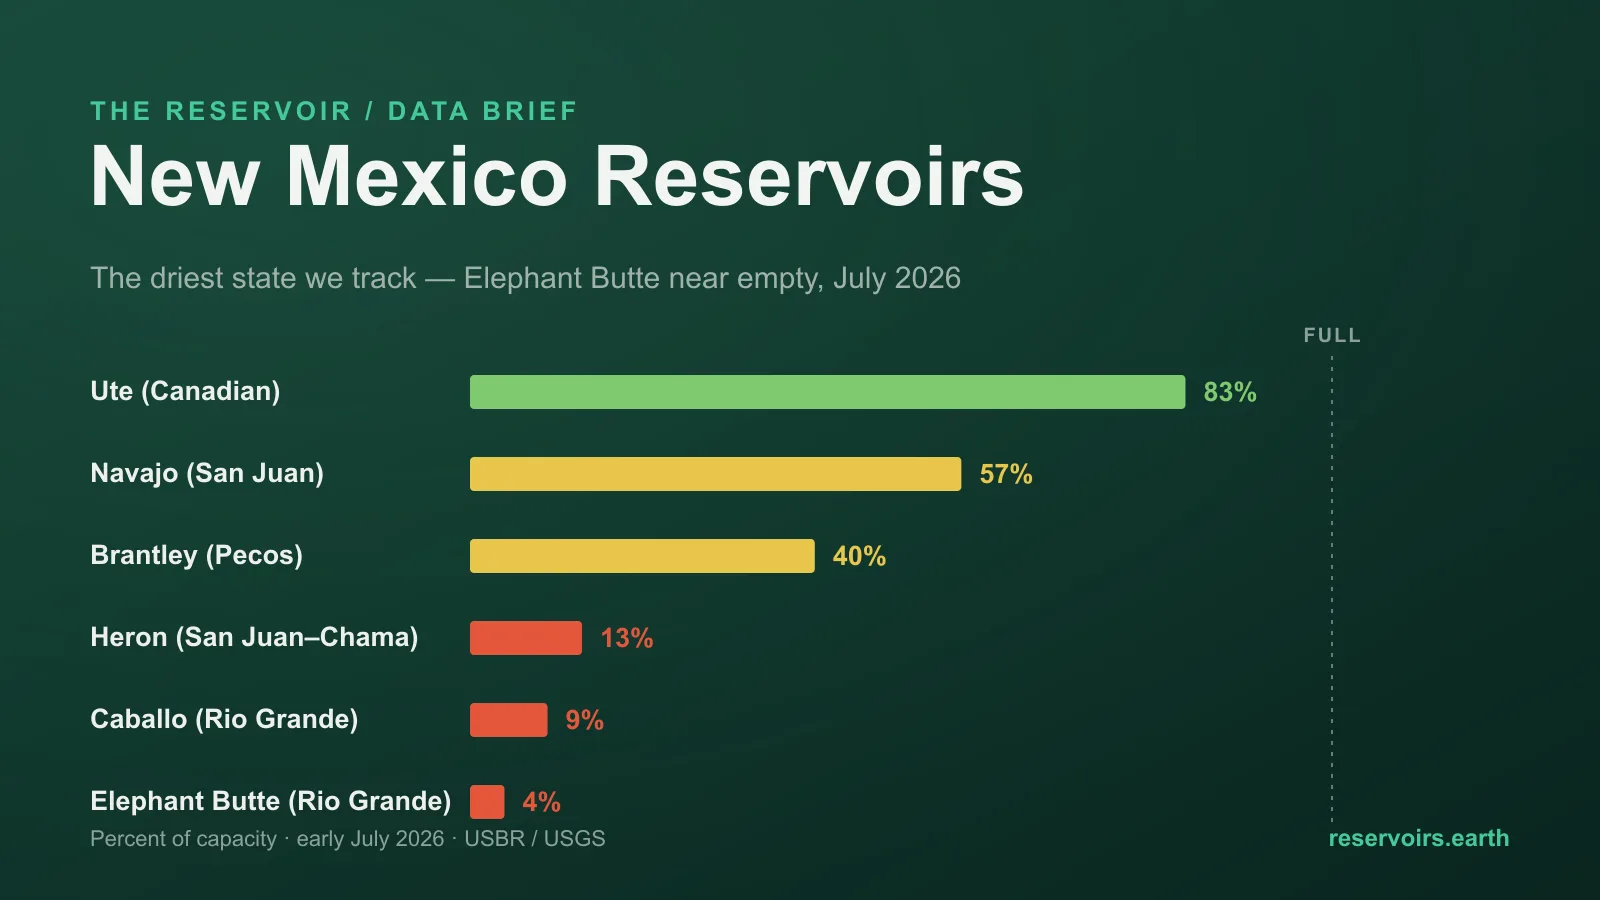
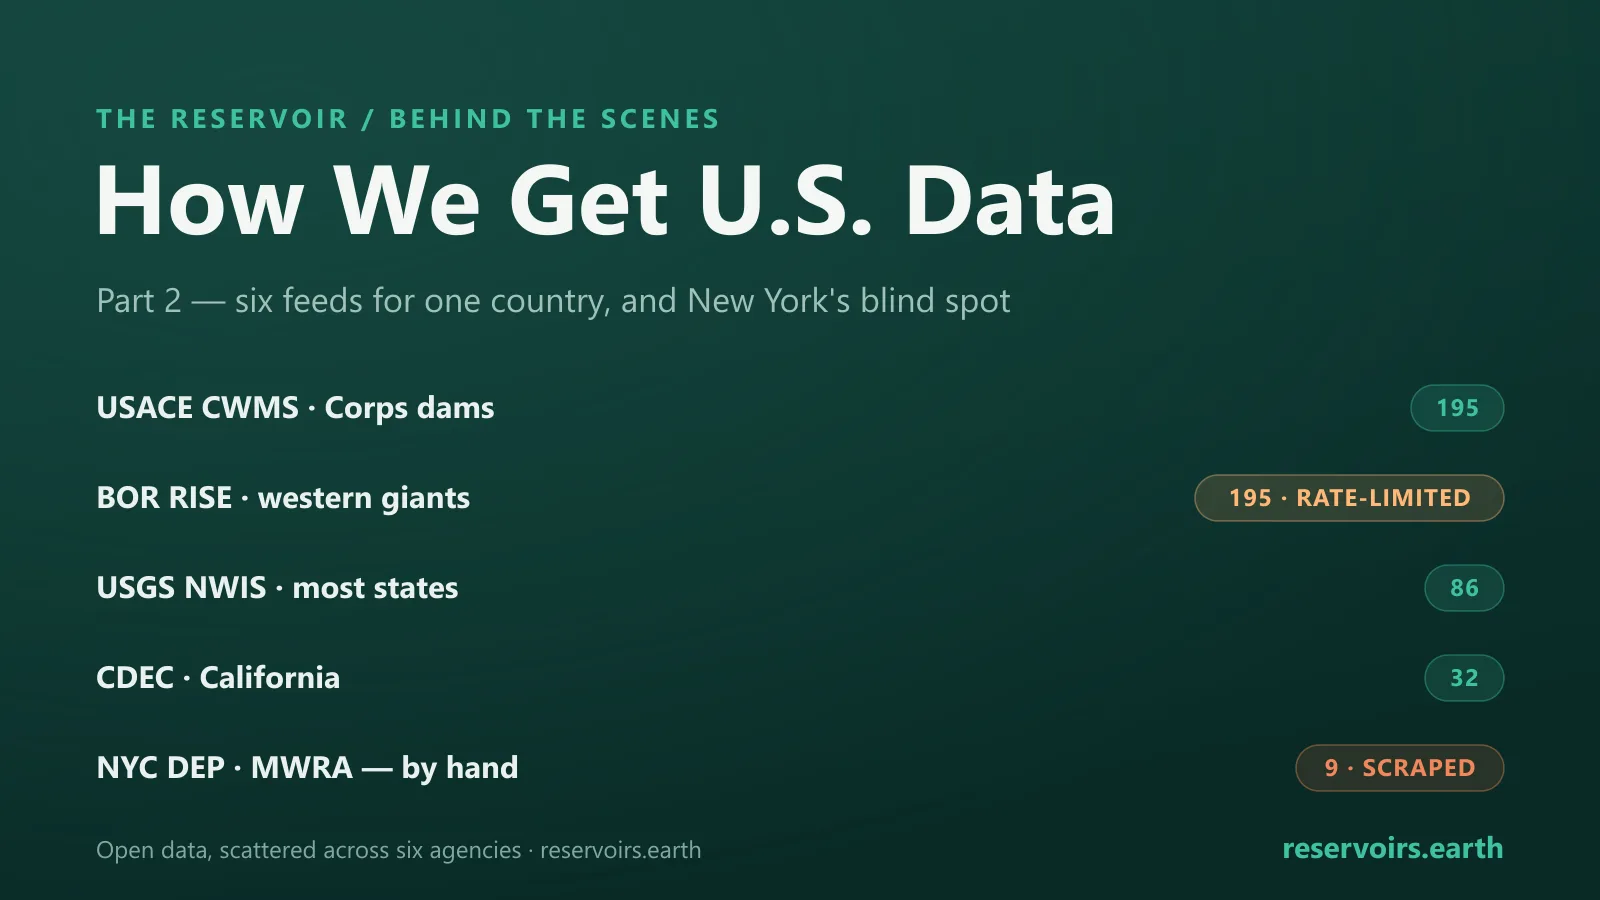
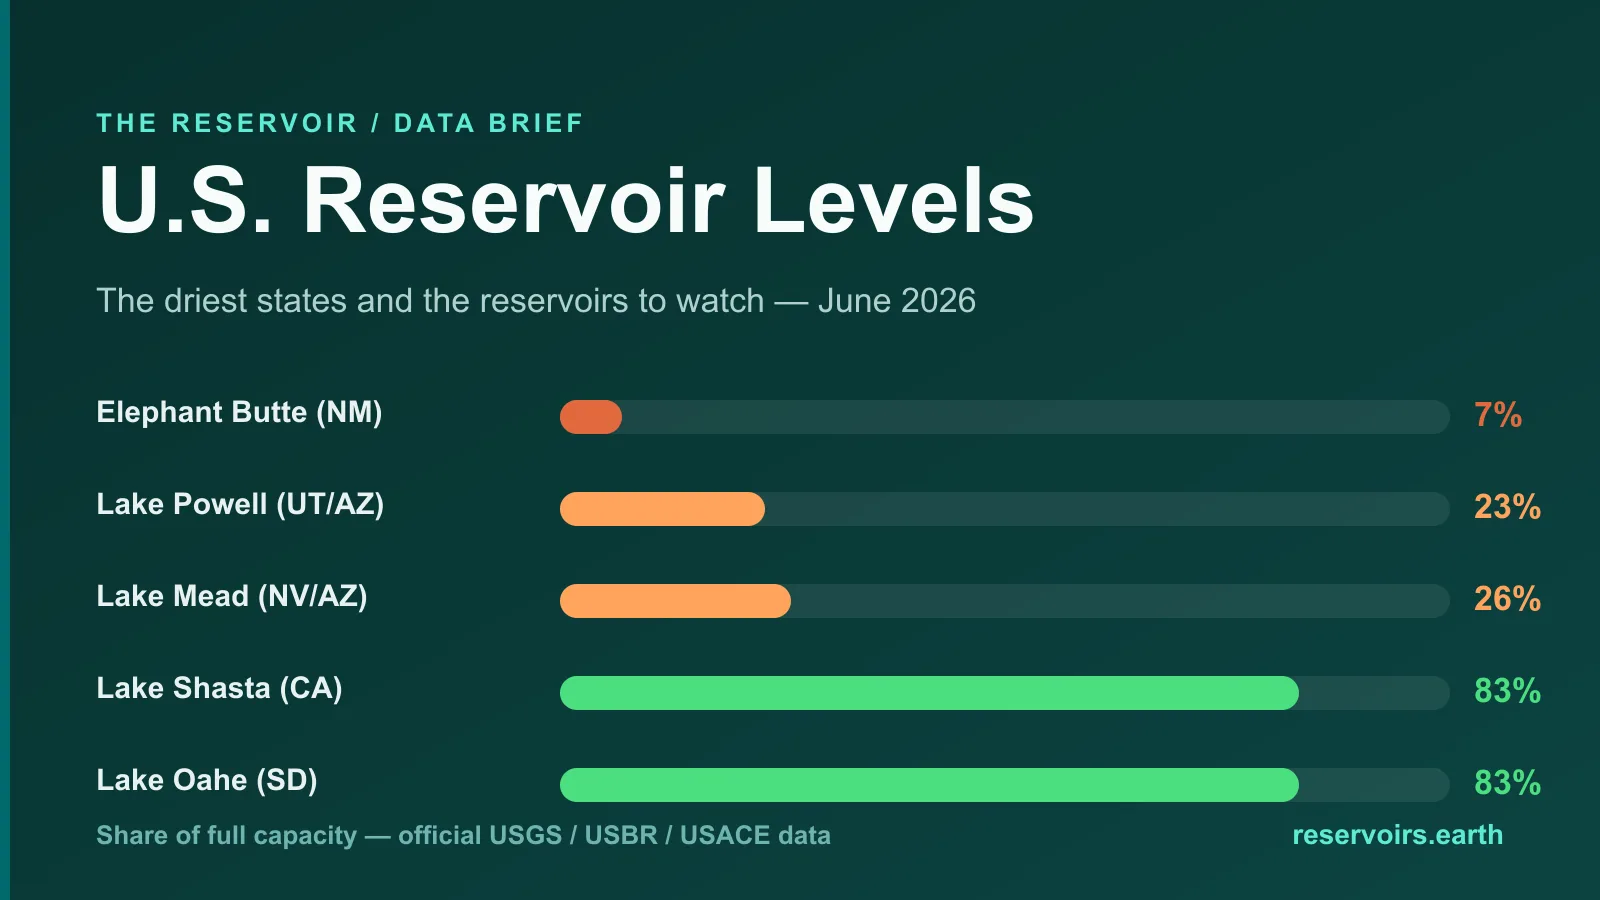
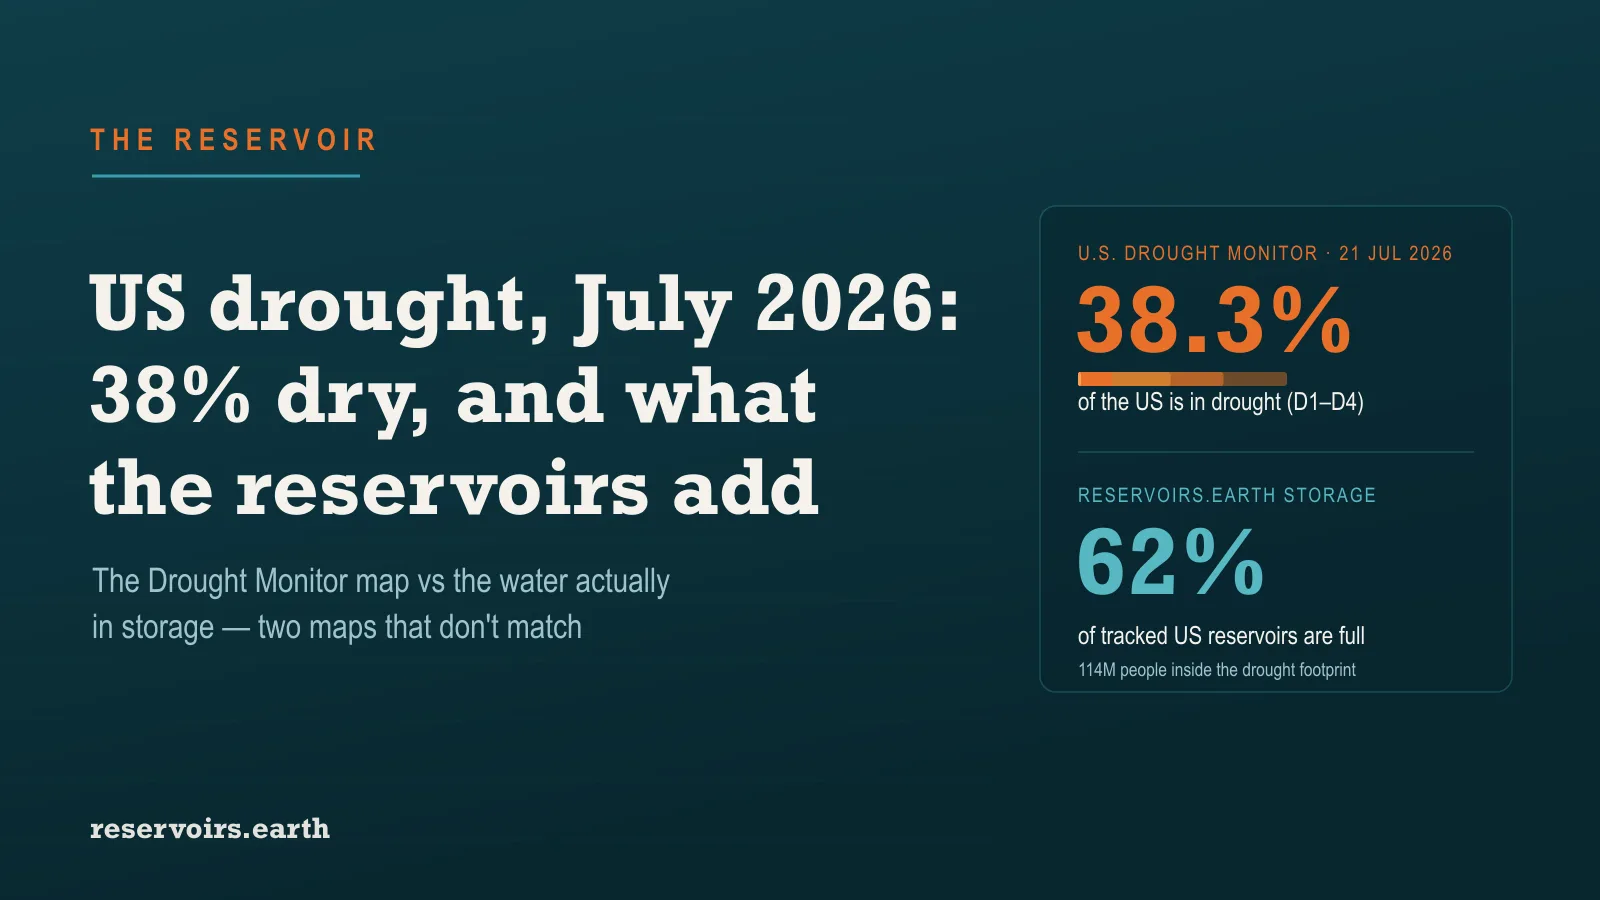
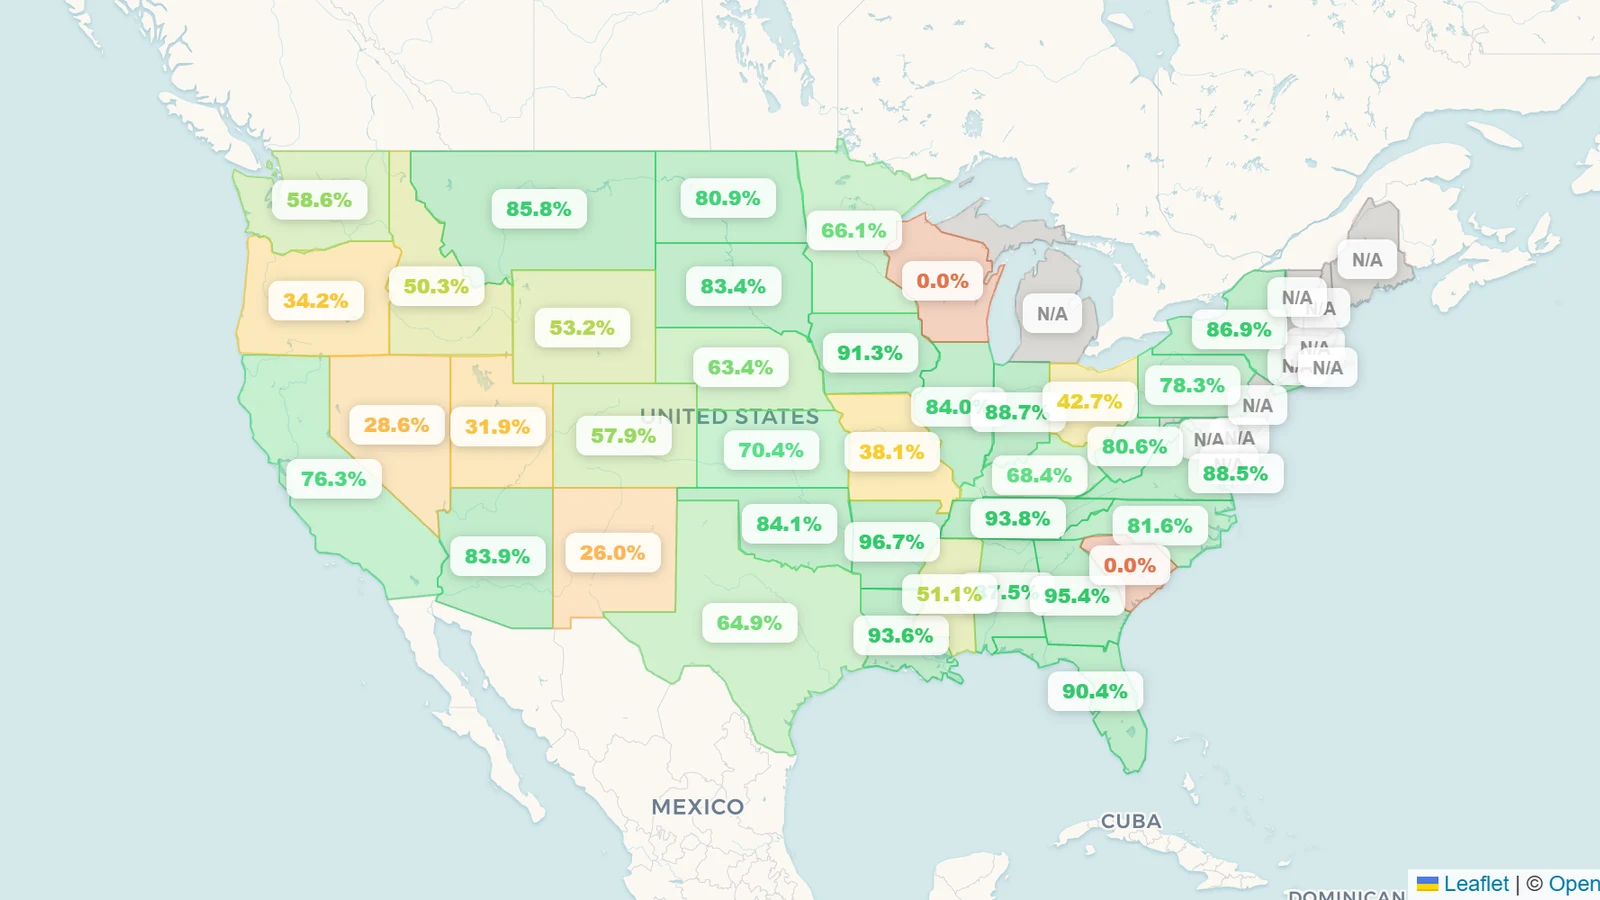
About 38% of the United States was in drought as of the U.S. Drought Monitor's 21 July 2026 reading — 45.8% of the Lower 48, an area home to roughly 114 million people — with a wider 55% at least abnormally dry and 45 states under some moderate drought or worse. That is the official weekly map of where the country is dry. It is not the same map as where the country's water is short: across the ~515 major reservoirs we track, US storage is about 62% full. The two diverge in ways that matter. The fastest deterioration is a hot flash drought across the Northern Plains and Upper Midwest — the Dakotas, Minnesota, Wisconsin — where the big reservoirs are still 80%+ full, because storage lags the weather by months. The emptiest water bank is the Southwest, where the Monitor and the reservoirs agree: New Mexico's reservoirs ~25%, Nevada's ~28%, and the Colorado River's Lake Mead and Lake Powell at 25% and 22%, near record lows. The Drought Monitor tells you where it is dry today; reservoir levels tell you where the water is already spent.
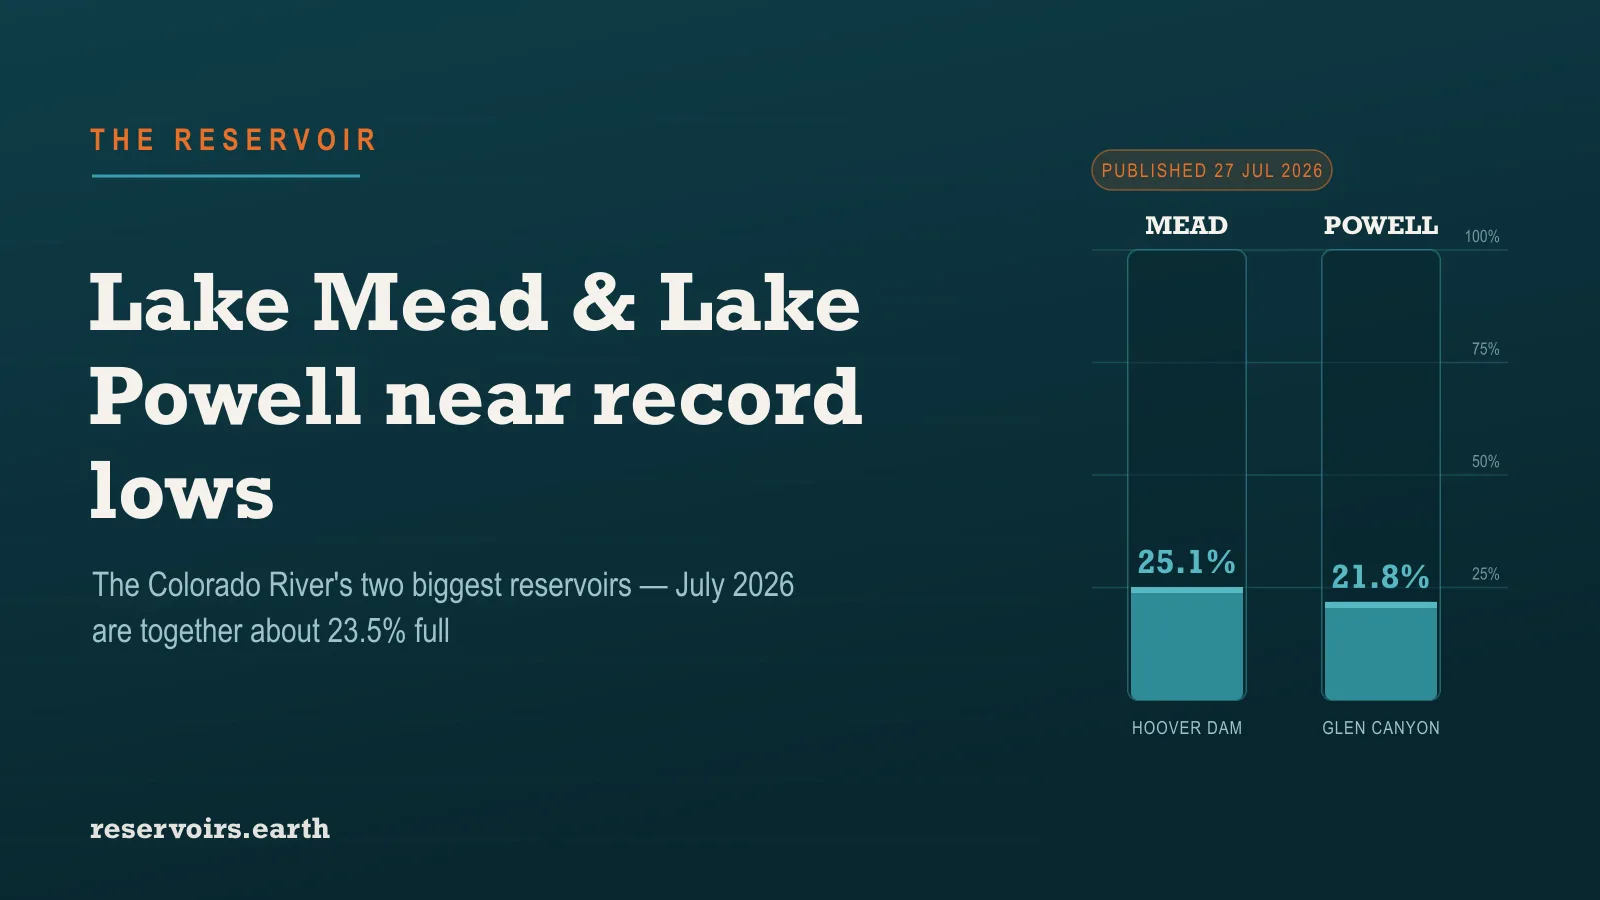
Lake Mead and Lake Powell Water Levels, July 2026: The Colorado River's Two Giants Are Near Record Lows
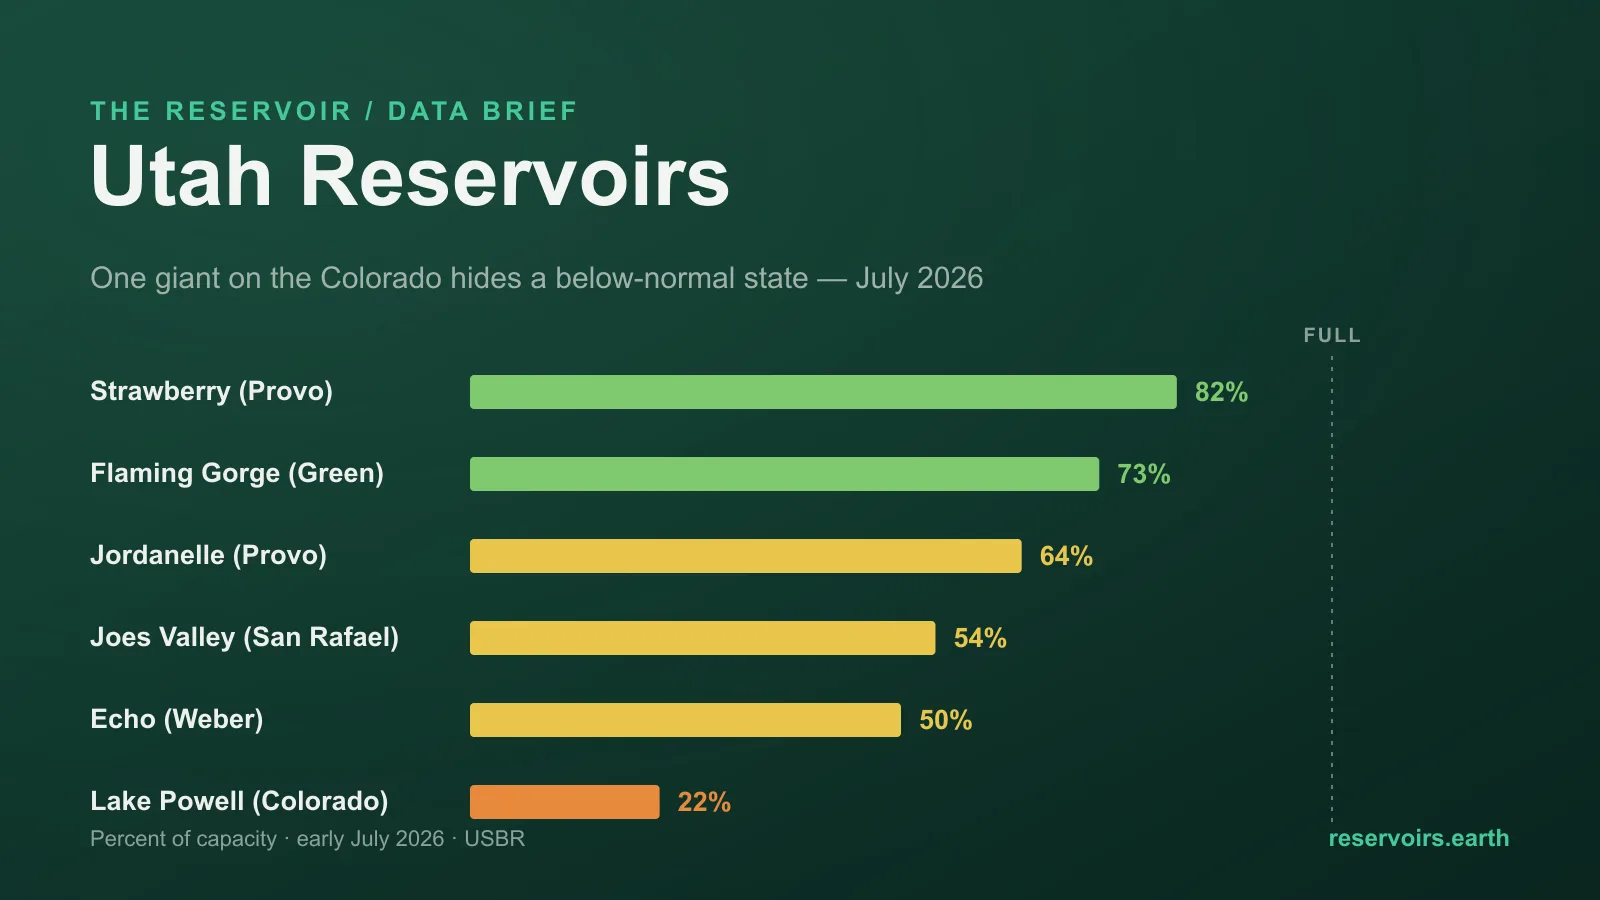
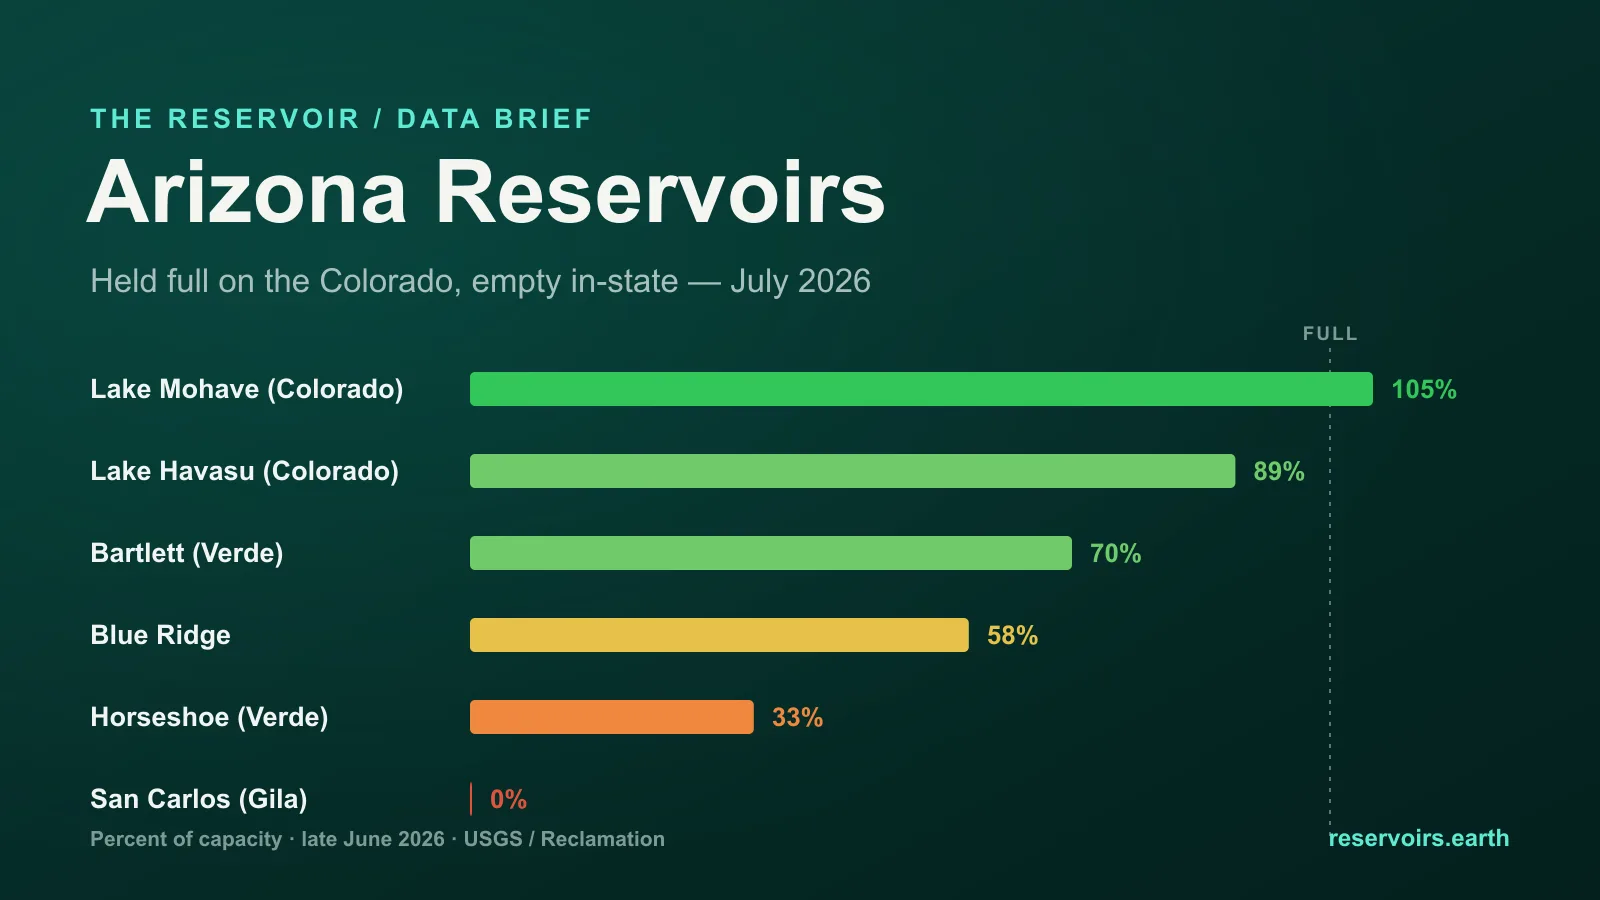
The two largest reservoirs in the United States sit on the same river, and both are running near empty. As of 21 July 2026, Lake Mead — behind Hoover Dam — is 25.1% full and Lake Powell, behind Glen Canyon Dam upstream, is 21.8% full, together holding about 23.5% of their combined 65.7 km³ capacity. Powell is the sharper emergency: at its lowest late-July level in five years and within a point of its 2023 record low, some 10 points below its July norm after another weak Rocky Mountain snowpack — and this low in the month it is normally fullest. Mead, at 25.1%, is all but tied with its summer-2022 record and drifting lower through the draw-down. These two hold most of the Colorado River's storage, the water bank for roughly 40 million people, and it is a quarter full — which is exactly why Arizona reads a comfortable 84% while Nevada reads 29%: the full-looking reservoirs downstream are held near the top by design, and the real water is here.
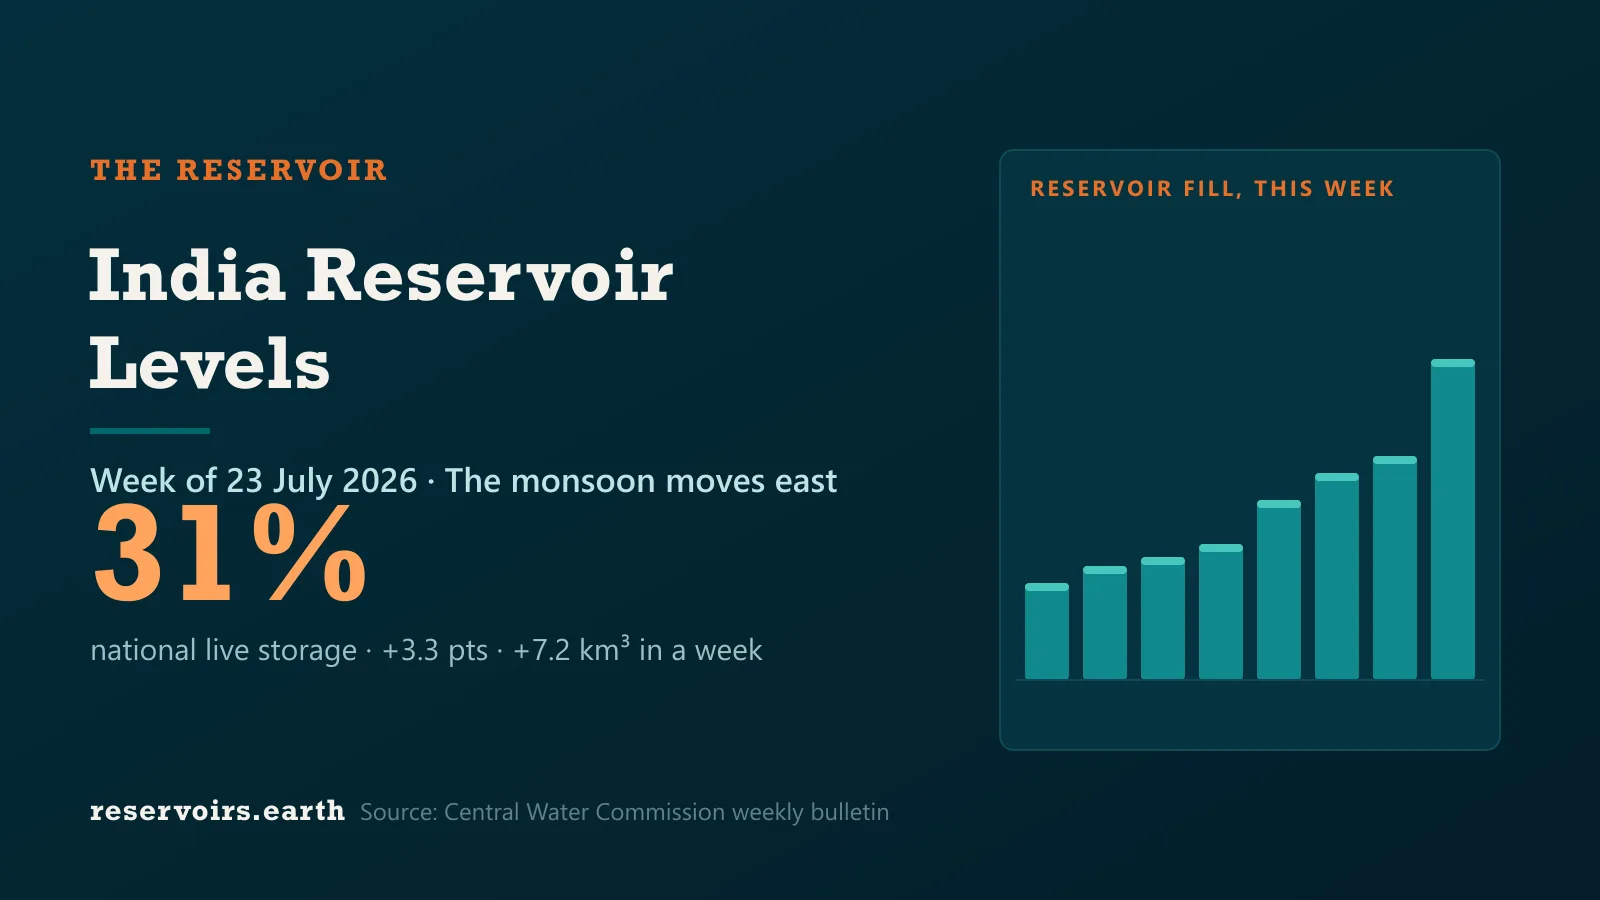
India Reservoir Levels, Week of 23 July 2026: Monsoon Refill Lifts Storage to 31% as the Rains Move East
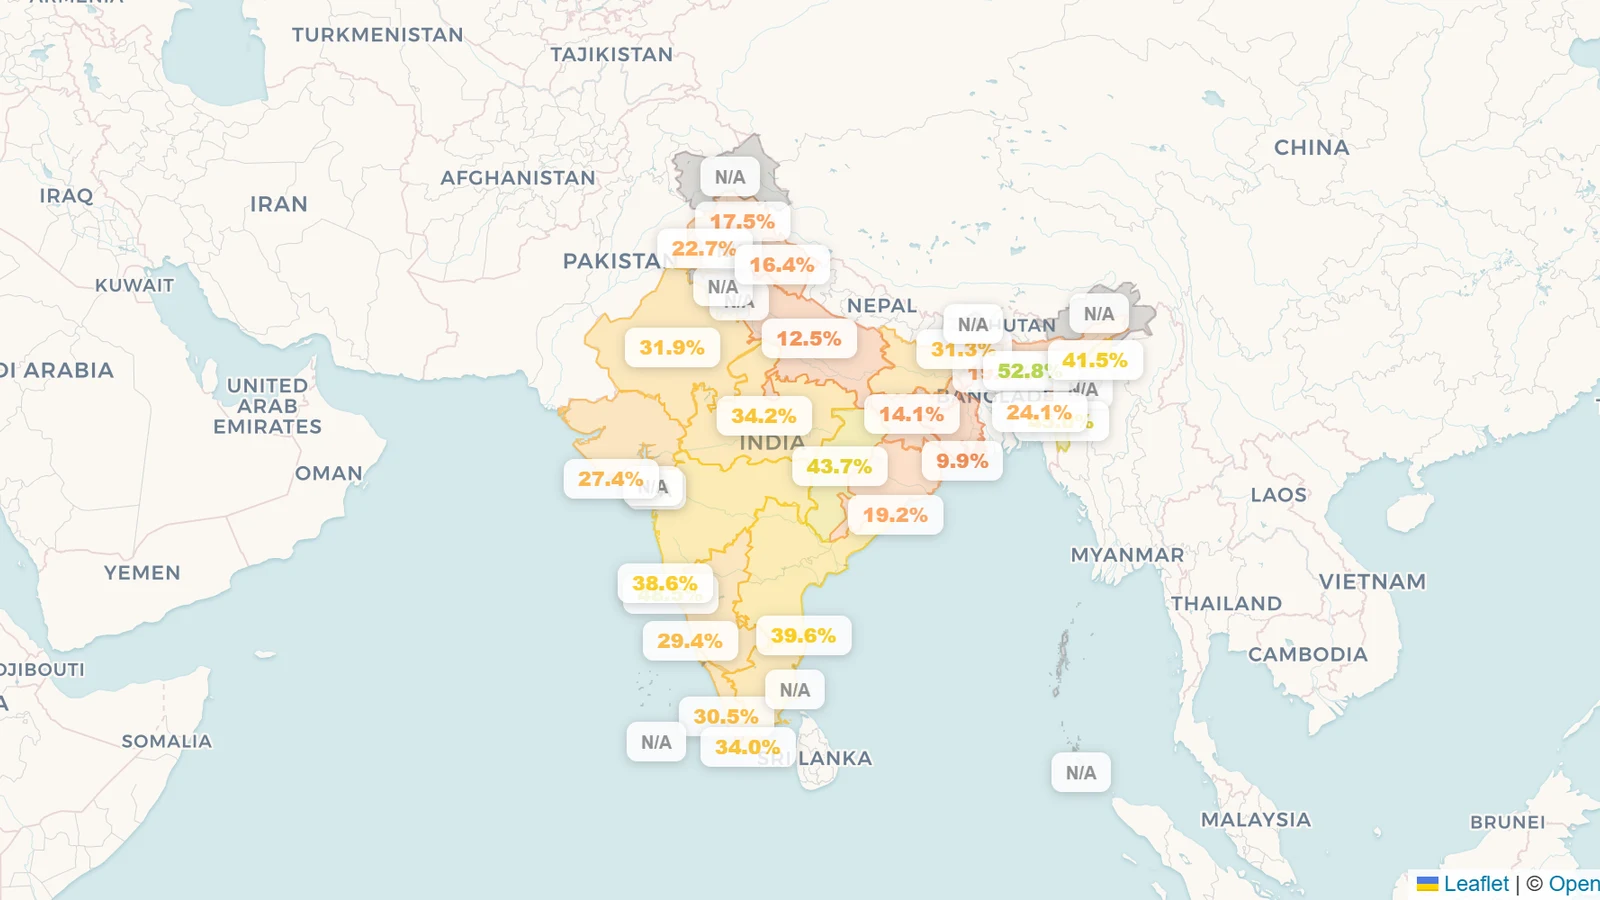
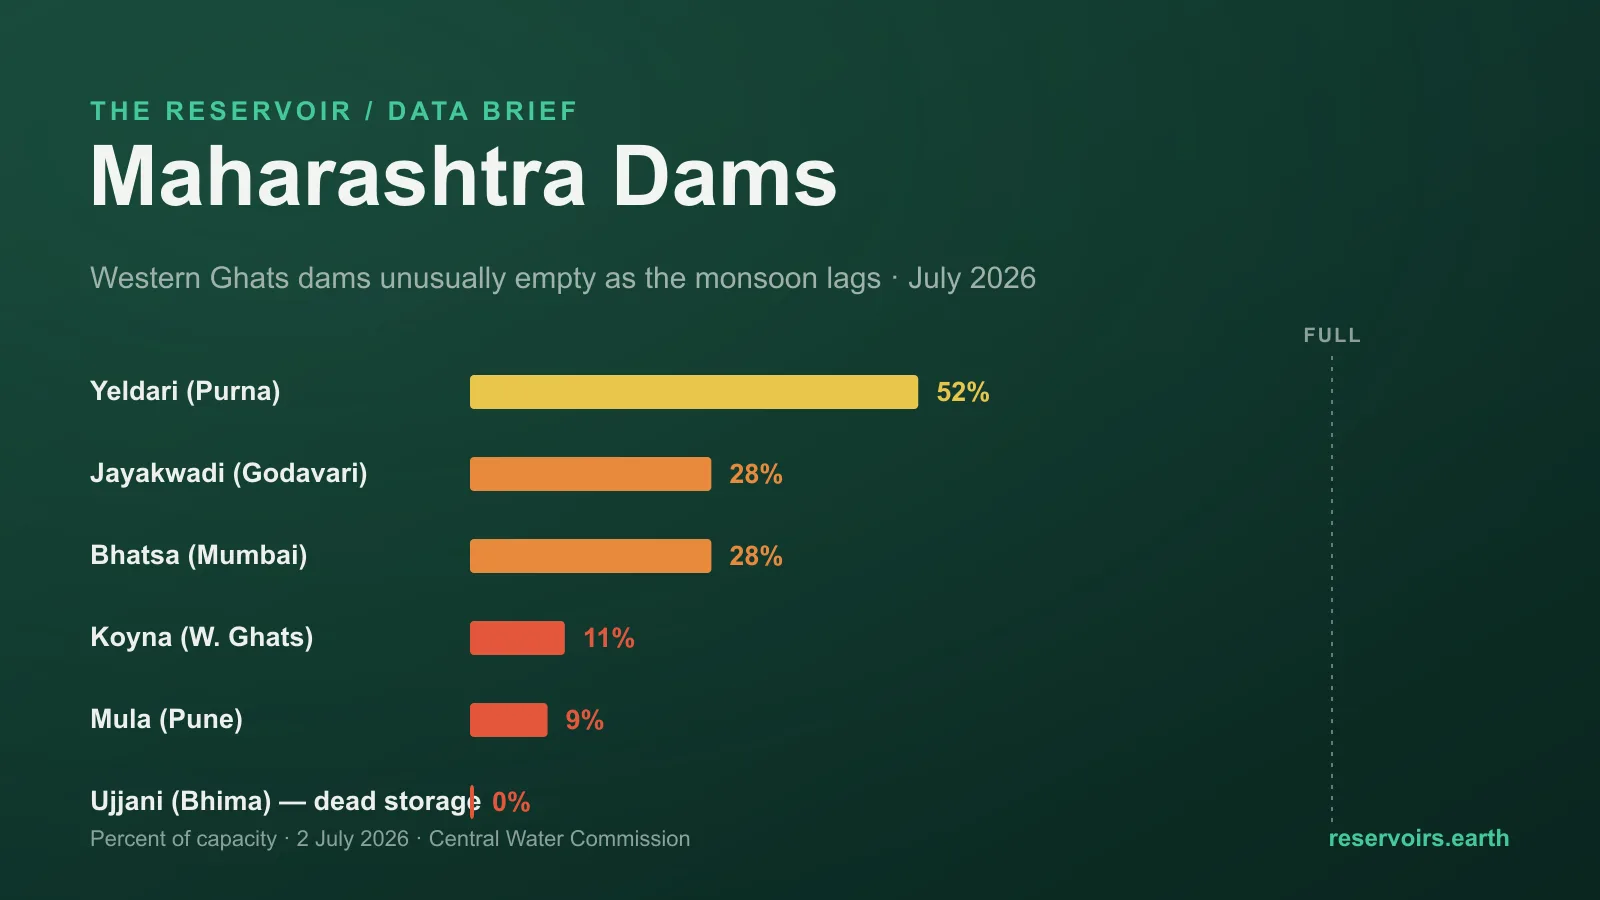
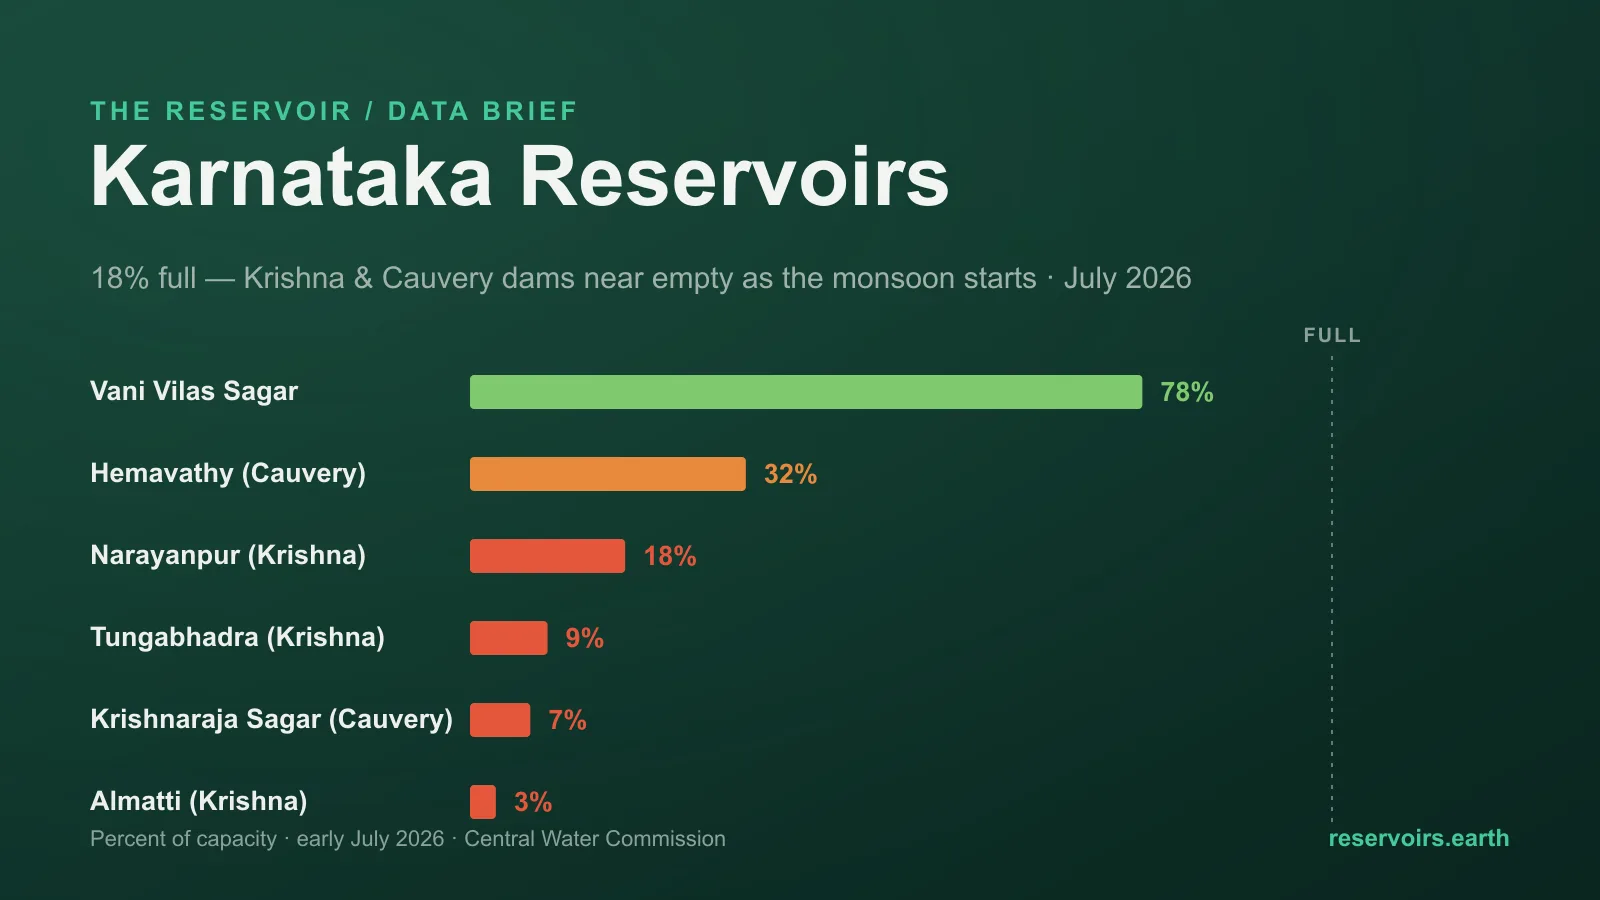
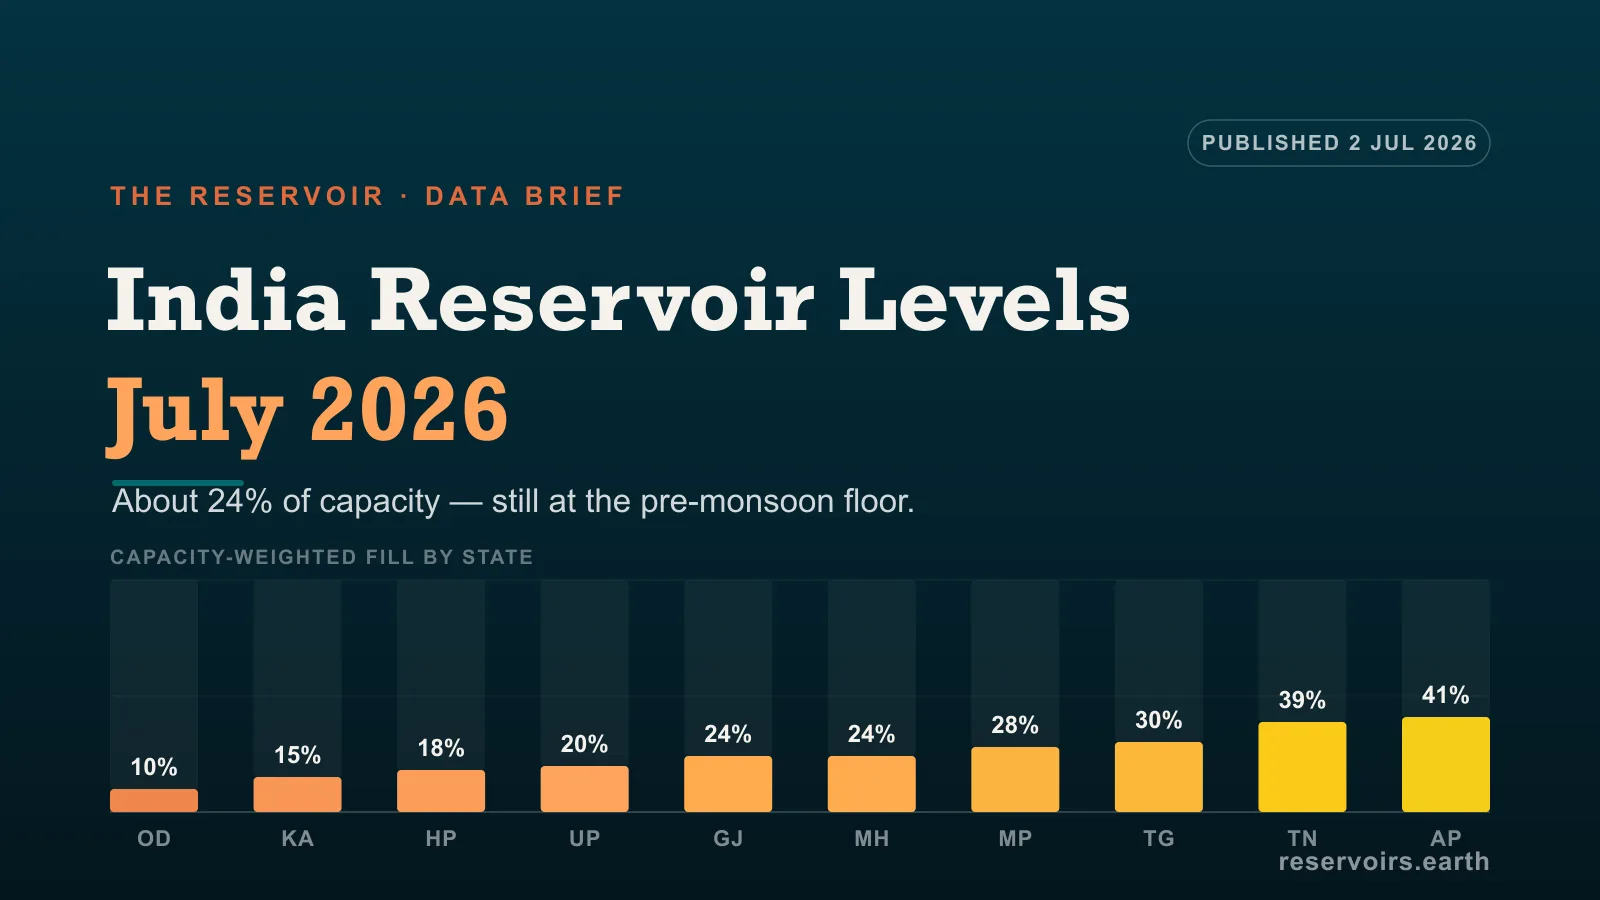
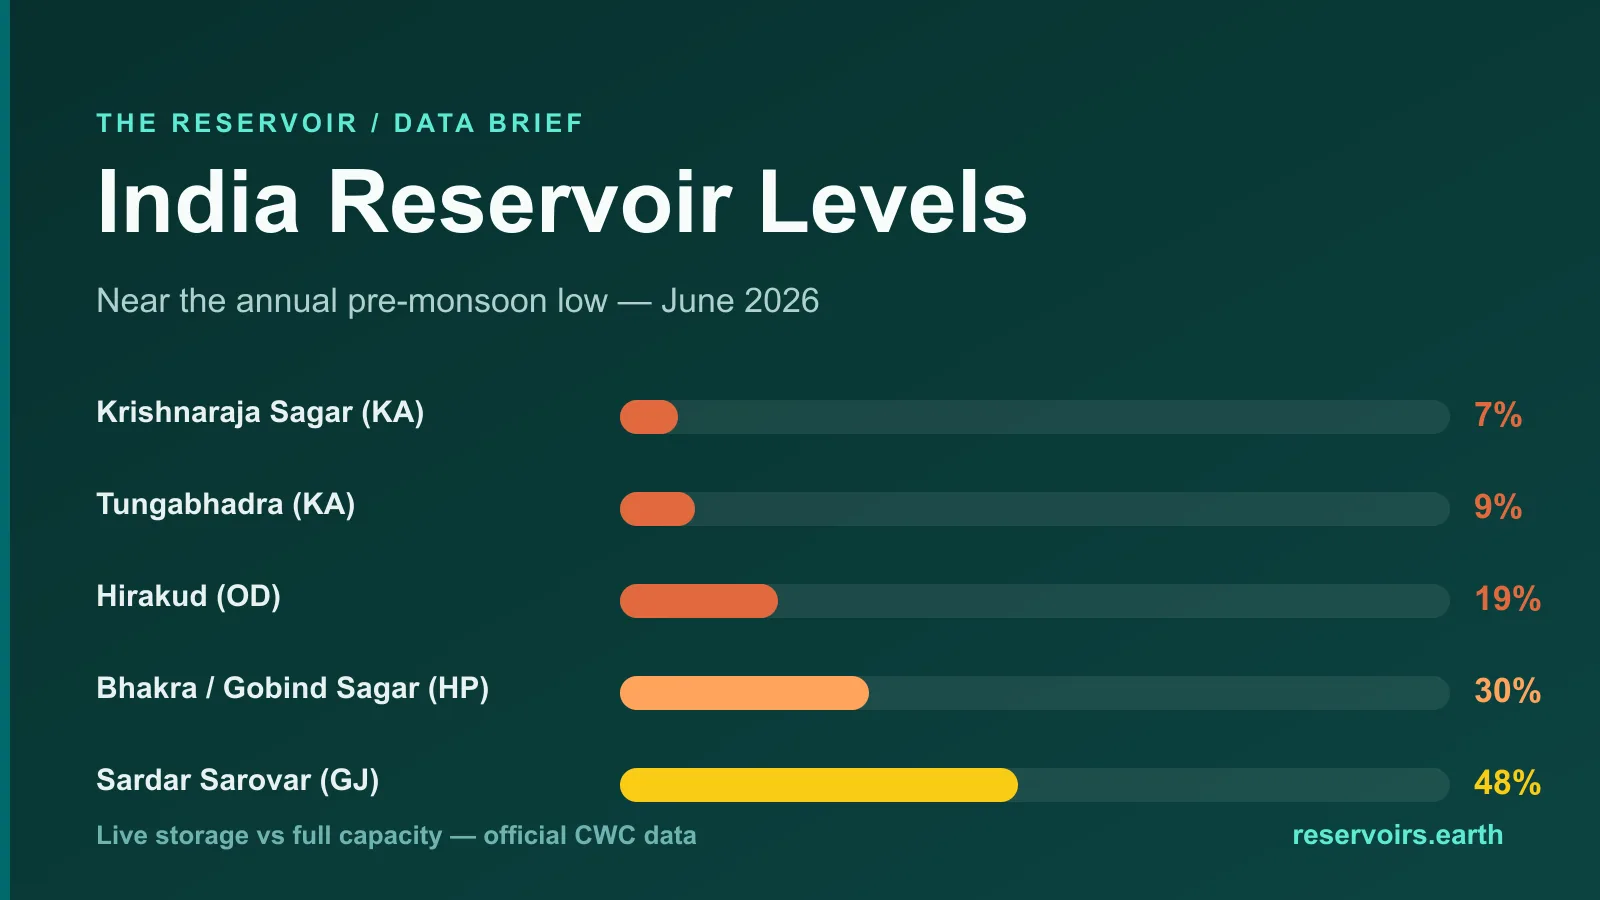
India's tracked reservoirs added 7.2 km³ in the fourth week of July, lifting the same-source national fill from 27.9% to 31.2% between the Central Water Commission's July 16 and July 23 bulletins. Where last week's gains were concentrated in Maharashtra's Pune-area dams, this week the monsoon band did its clearest work in the east and centre: Hirakud (Odisha) jumped 30% to 41%, Hasdeo Bango (Chhattisgarh) 59% to 73%, and the northern giants Bhakra and Pong added three points each. 88 of 149 reservoirs rose. The exception is the southern Krishna basin, where Nagarjuna Sagar sits at 3.2% of live storage — the emptiest big reservoir in the country — and Andhra Pradesh's tracked set is still losing water. At 31% full, national storage has climbed about ten points off its pre-monsoon floor over two strong weeks, with the back half of the monsoon still to run.
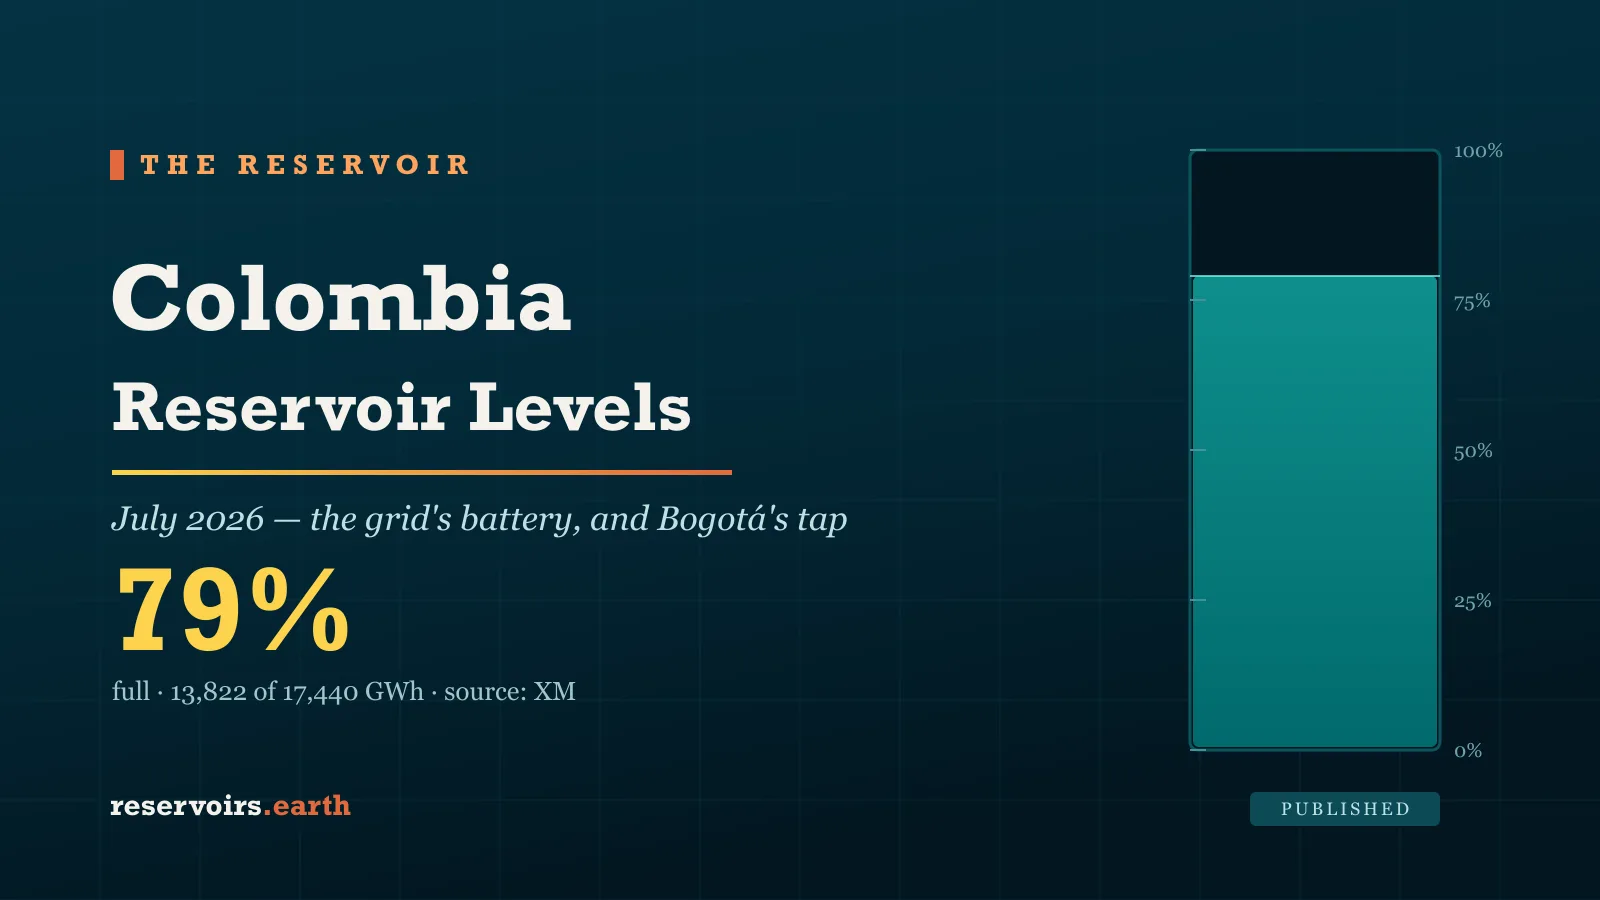
Colombia Reservoir Levels, July 2026: 79% Full — the Country's Battery, and Bogotá's Tap
Colombia's hydropower reservoirs are 79% full as of 21 July 2026 — 13,822 of 17,440 GWh of storable electricity, a shade above the mid-July norm and about 1.5 points below a year ago. In a grid where hydropower is roughly two-thirds of generation, that number is a power-price gauge before it is a water gauge: XM publishes it daily, and it is the same figure that nearly triggered rationing during the 2023–24 El Niño. The two giants carry it — El Peñol–Guatapé at 90.5% and Guavio at 97.3%, together a quarter of national storage. The soft spot is the Chingaza system that supplies Bogotá's drinking water, in the 60s — the one large storage where a low reading is a water-supply story, not just a power one. With XM flagging renewed El Niño alerts in May 2026, the number to watch is what the reservoirs hold going into the dry season.
Taiwan Reservoir Levels, July 2026: Comfortable Now, but Watch the Typhoons
Taiwan's reservoirs are in comfortable shape in mid-July 2026 — a quiet contrast to the island's 2021 water emergency. The reservoirs supplying its biggest cities are well-stocked: Zengwen, the largest in the country and the backbone of Tainan and Chiayi, sits near 77% of effective capacity; Feitsui, which supplies Taipei, is around 80%; and Shimen, serving Taoyuan and Hsinchu, is essentially full. The one striking outlier is the small Agongdian reservoir near Kaohsiung, under 5%. Taiwan's Water Resources Agency publishes daily open data — ranking the island 4th of 167 countries on the Reservoir Transparency Index — but the numbers hide a slow-burning problem: decades of sedimentation have cut usable storage sharply (Zengwen has lost nearly 40% of its design capacity to silt), and the island depends on a handful of typhoons each year to refill. The real risk is volatility, not today's level.
South Africa Stopped Publishing Its Reservoir Data — What We Can and Can't See
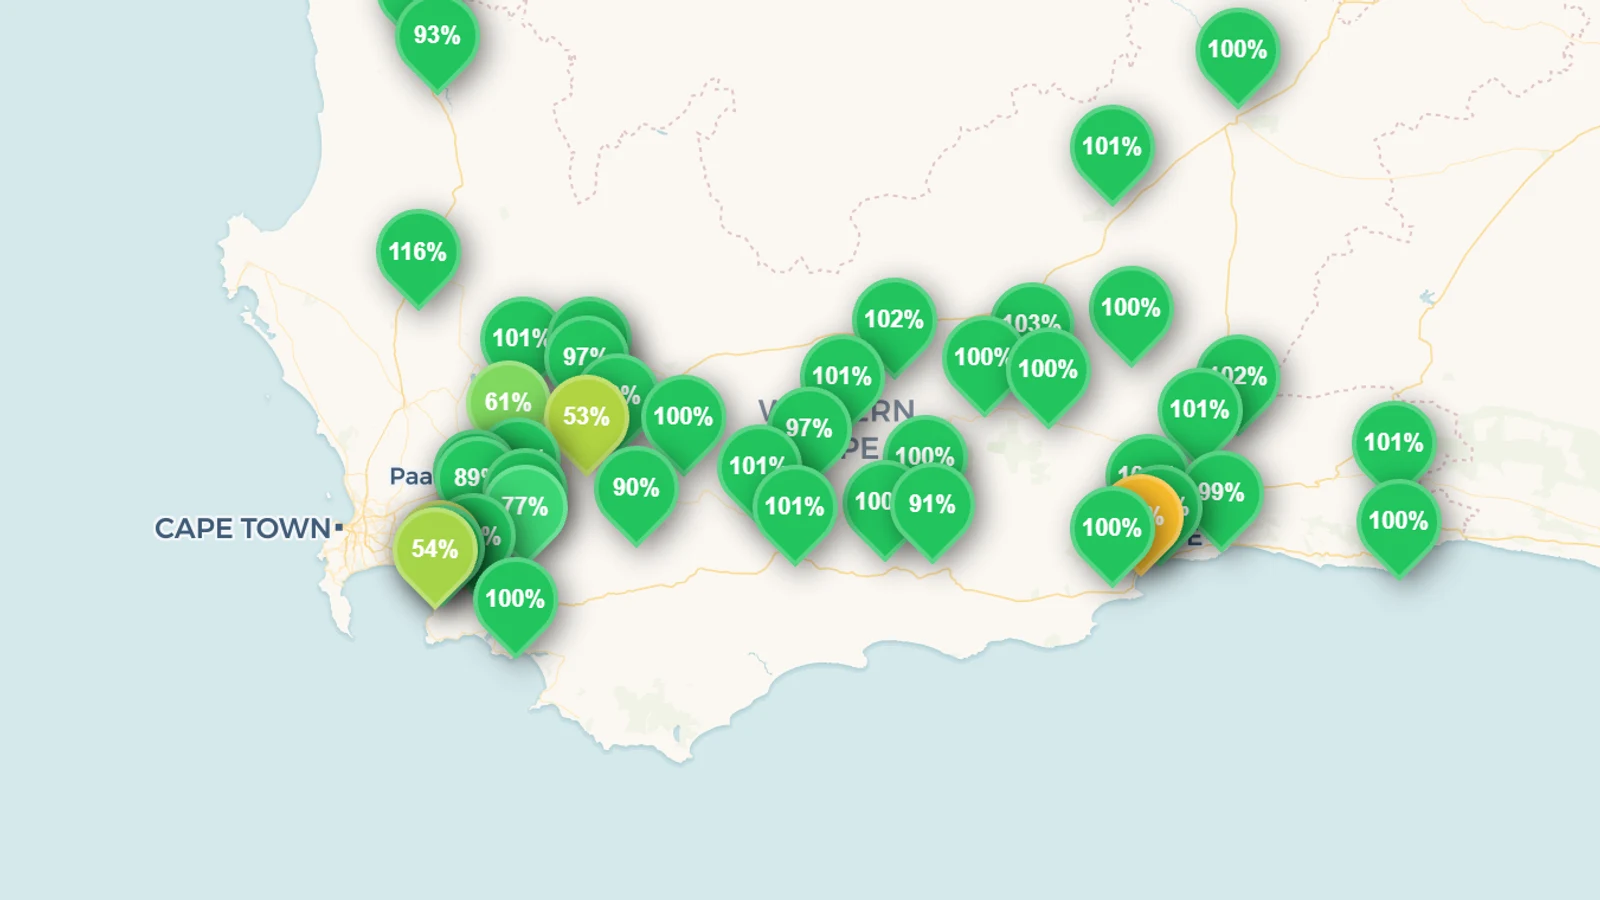
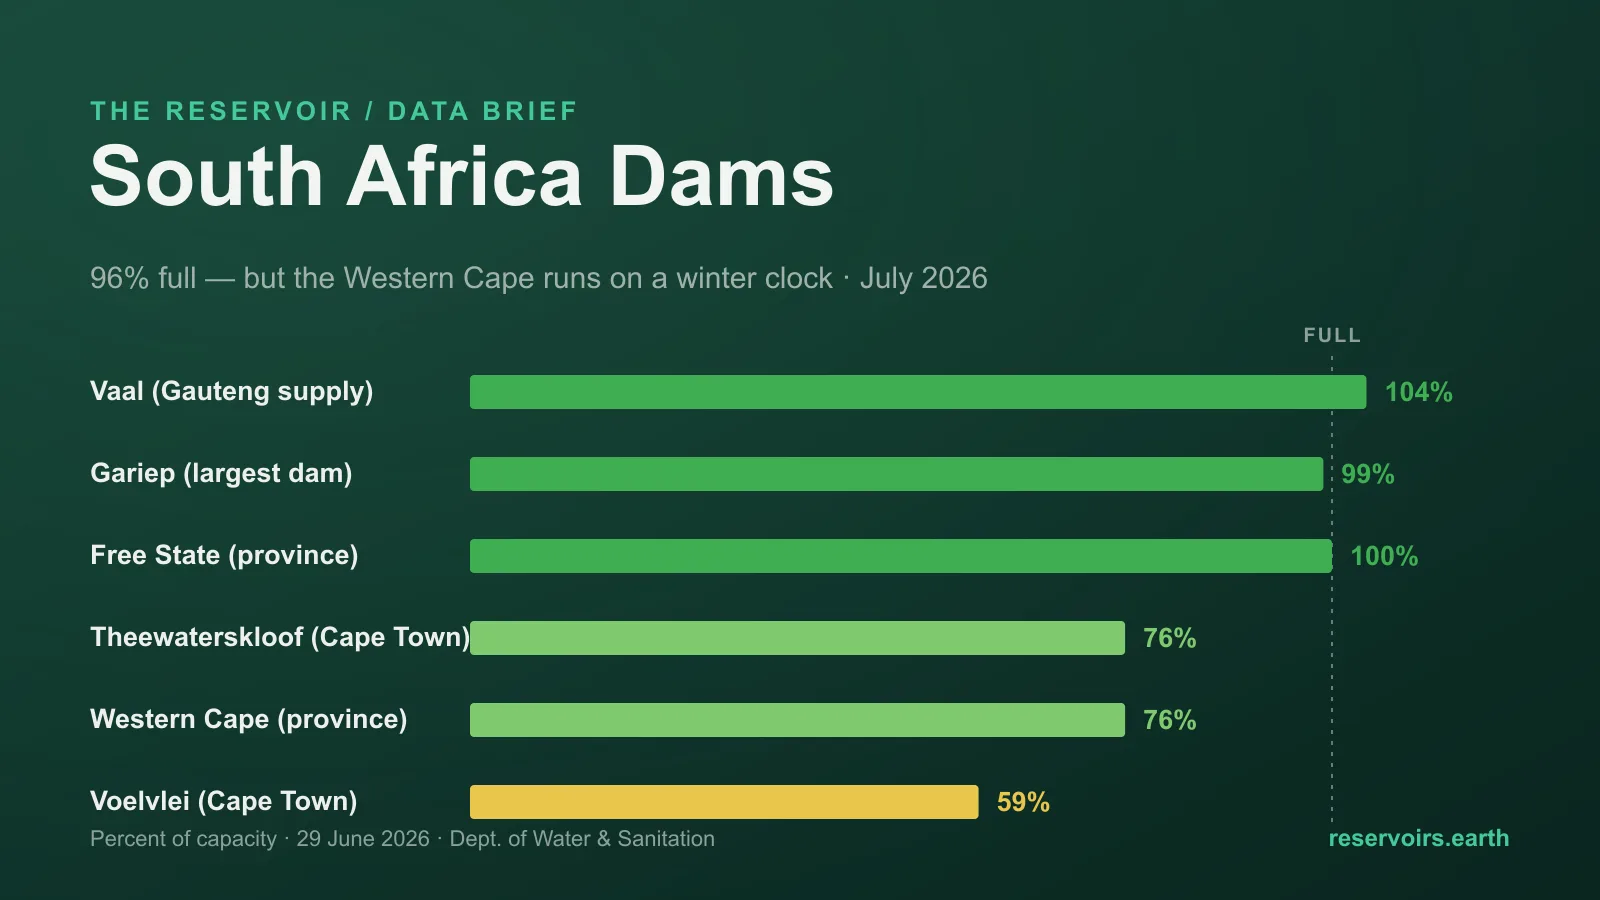
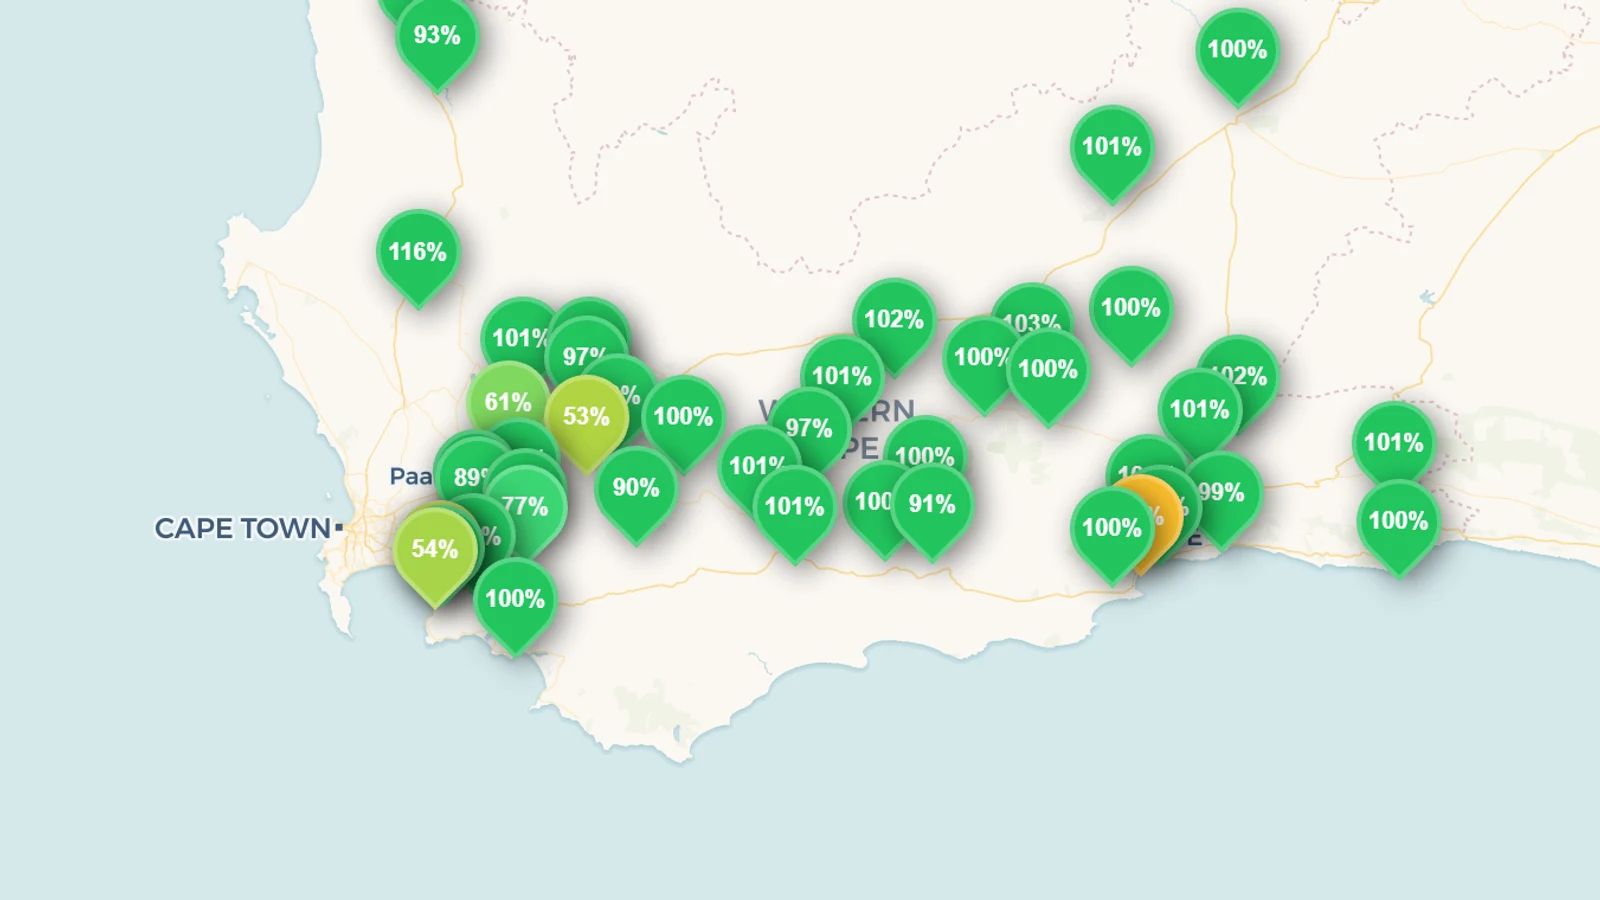
South Africa — the country that gave the world the phrase "Day Zero" — has stopped publishing its national reservoir data. As of 21 July 2026, the most recent nationwide bulletin from the Department of Water and Sanitation (DWS) covers readings dated 29 June 2026, roughly three missed weekly updates ago. The last figures were reassuring — every province above 88% except a healthy Western Cape near 77% — but that is the problem: no one outside DWS can now independently confirm what South Africa's dams are doing. This is a transparency failure, not (yet) a water failure, and it exposes the weakness the Reservoir Transparency Index has always flagged: South Africa publishes through a single fragile web page with no public API, so when the page stalls, the data simply disappears from public view.
Which Regions Are Closest to Day Zero? Checking All 11 Countries We Track (2026)
"Day Zero" — the date a city's taps run dry — was coined in Cape Town in 2018. Eight years on, we checked all eleven countries we track for regions near the same fate. The honest answer as of mid-July 2026: no tracked region faces an imminent, taps-about-to-close Day Zero, and the region that invented the term has recovered to about 77% full. But the structural pressure is real and concentrated. The US Southwest is living through a slow, managed shortage on the Colorado and Rio Grande — New Mexico, Nevada and Utah are the driest states and Elephant Butte on the Rio Grande sits at roughly 2% of capacity. India's southern states face the same monsoon gamble every summer, and Spain's southeast and southern Taiwan are the catchments most likely to tighten first. This is the data-led watchlist — and why an empty hydropower reservoir is not a Day Zero.
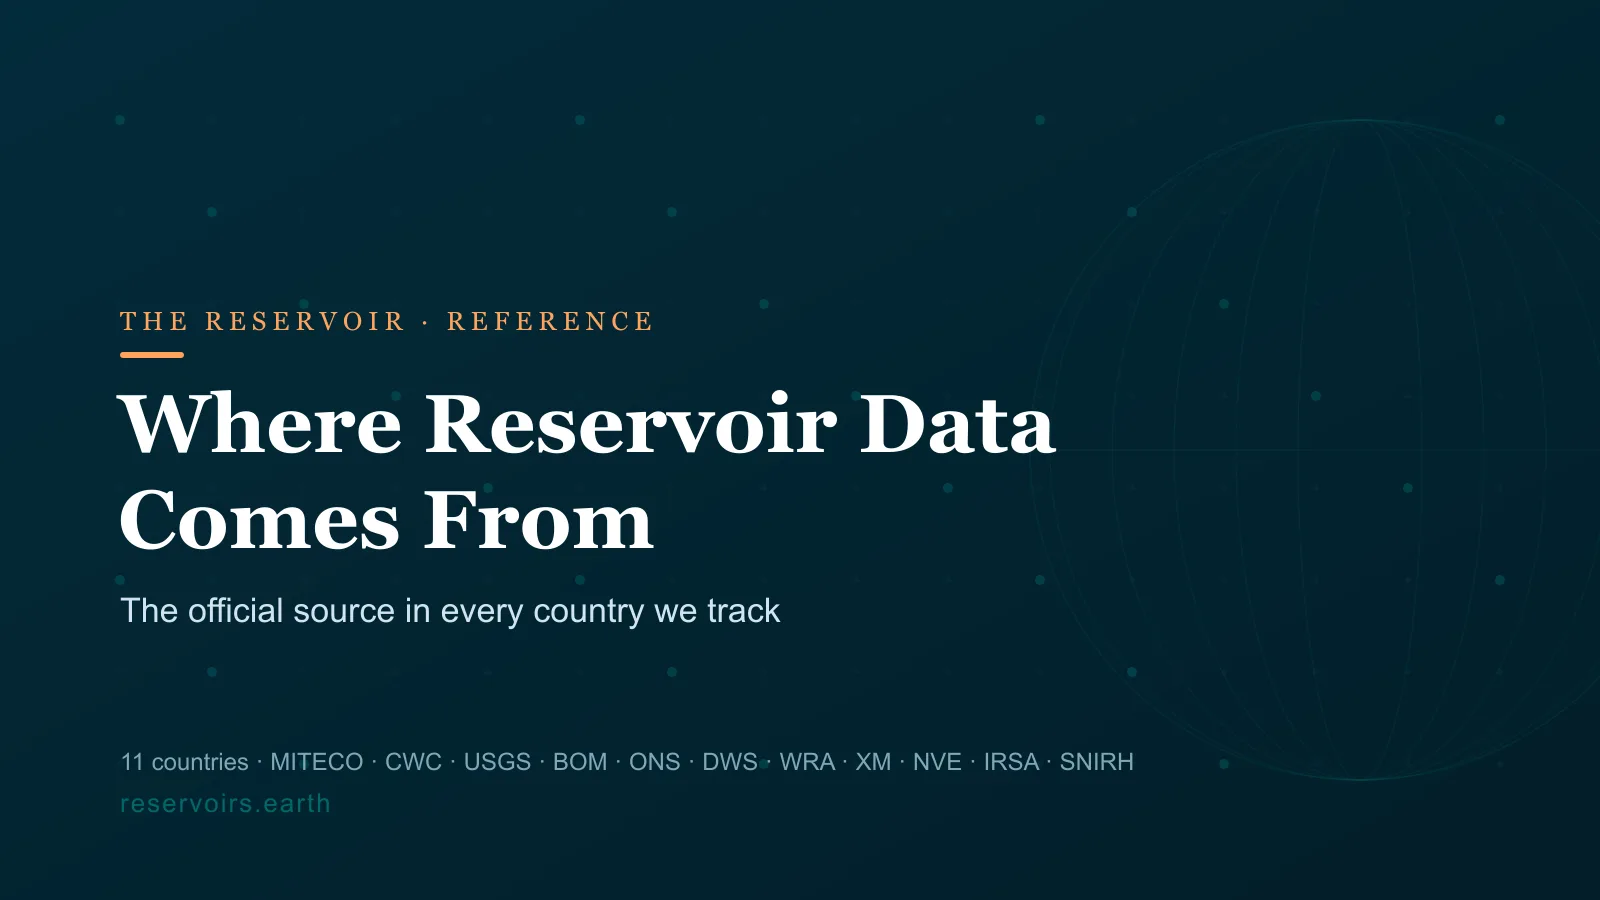
Where Reservoir Data Comes From: The Official Source in Every Country We Track
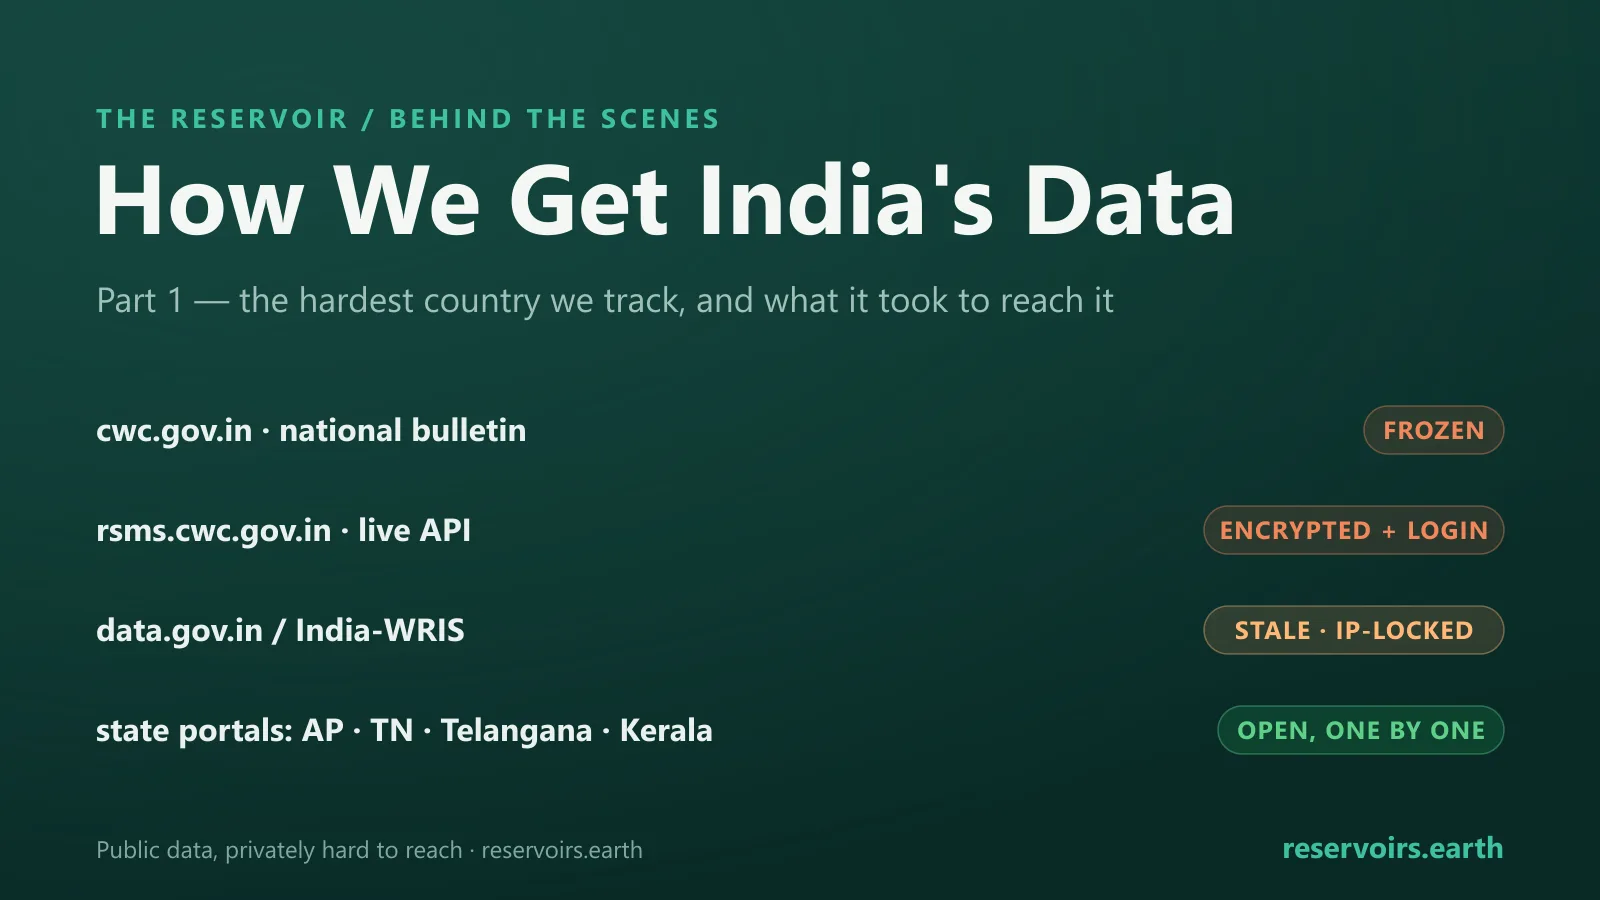
There is no single global database of reservoir levels — every country publishes its own, through its own agency, in its own units, and the gap between the best and the worst is enormous. Australia's Bureau of Meteorology and Taiwan's Water Resources Agency offer clean open APIs you can query from anywhere; India's Central Water Commission hides the same numbers behind a weekly PDF, a geo-block and a login; and Colombia and Norway report their reservoirs as stored energy rather than water. This is the directory of the official reservoir-data source in each of the eleven countries we track — what it publishes, how often, and how open it actually is — and the raw material behind our Reservoir Transparency Index.
Day Zero: The Cities That Nearly Ran Dry, and How to Avoid the Next One
"Day Zero" — the day a city shuts its taps and rations water at collection points — was coined in Cape Town in 2018, which defined it as its dams falling below 13.5% of capacity. Cape Town never reached it, but the countdown has since run in city after city: Chennai's reservoirs fell to 0.2% full in 2019, Monterrey actually lost its taps for weeks in 2022, Montevideo blended salt water into its supply in 2023, and Bogotá rationed nine million people for a year in 2024–25. Day Zero is a demand-vs-storage failure, not a freak of weather — and a Nature Communications projection has the number of large cities facing water scarcity rising from 193 in 2016 to 292 by 2050. It is also avoidable: Cape Town escaped mainly by halving demand. Here is the roster of who came closest, why it is spreading, and the four-lever playbook — cut demand, publish the data, diversify supply, stop the leaks — for avoiding the next one.
Water Reuse and Fewer New Reservoirs: Why the Shift Spares the Ecosystem
In the water-stressed rich world, the next unit of supply increasingly comes from reusing water already used once, which lets a country build fewer new reservoirs to cover the same demand — and that shift is the ecosystem-preserving one. The economics drive it: the best dam sites are taken, and a reservoir is a depreciating asset that silts up (large dams are on track to lose ~26% of storage by 2050) and evaporates (about 13% of the entire Colorado River each year). Reuse is proven and rainfall-independent — Israel recycles ~90% of its wastewater, Singapore's NEWater meets ~40% of demand, Orange County purifies 130 million gallons a day, Windhoek has drunk recycled water since 1968. Meanwhile the US removed 108 dams in 2024, tied for the most ever. Reuse keeps the water loop inside the city, so rivers stay connected, deltas stay fed, and no new valley is drowned.
Spain Reservoir Levels, July 2026: 77% Full and Well Above Normal as the Drought Breaks
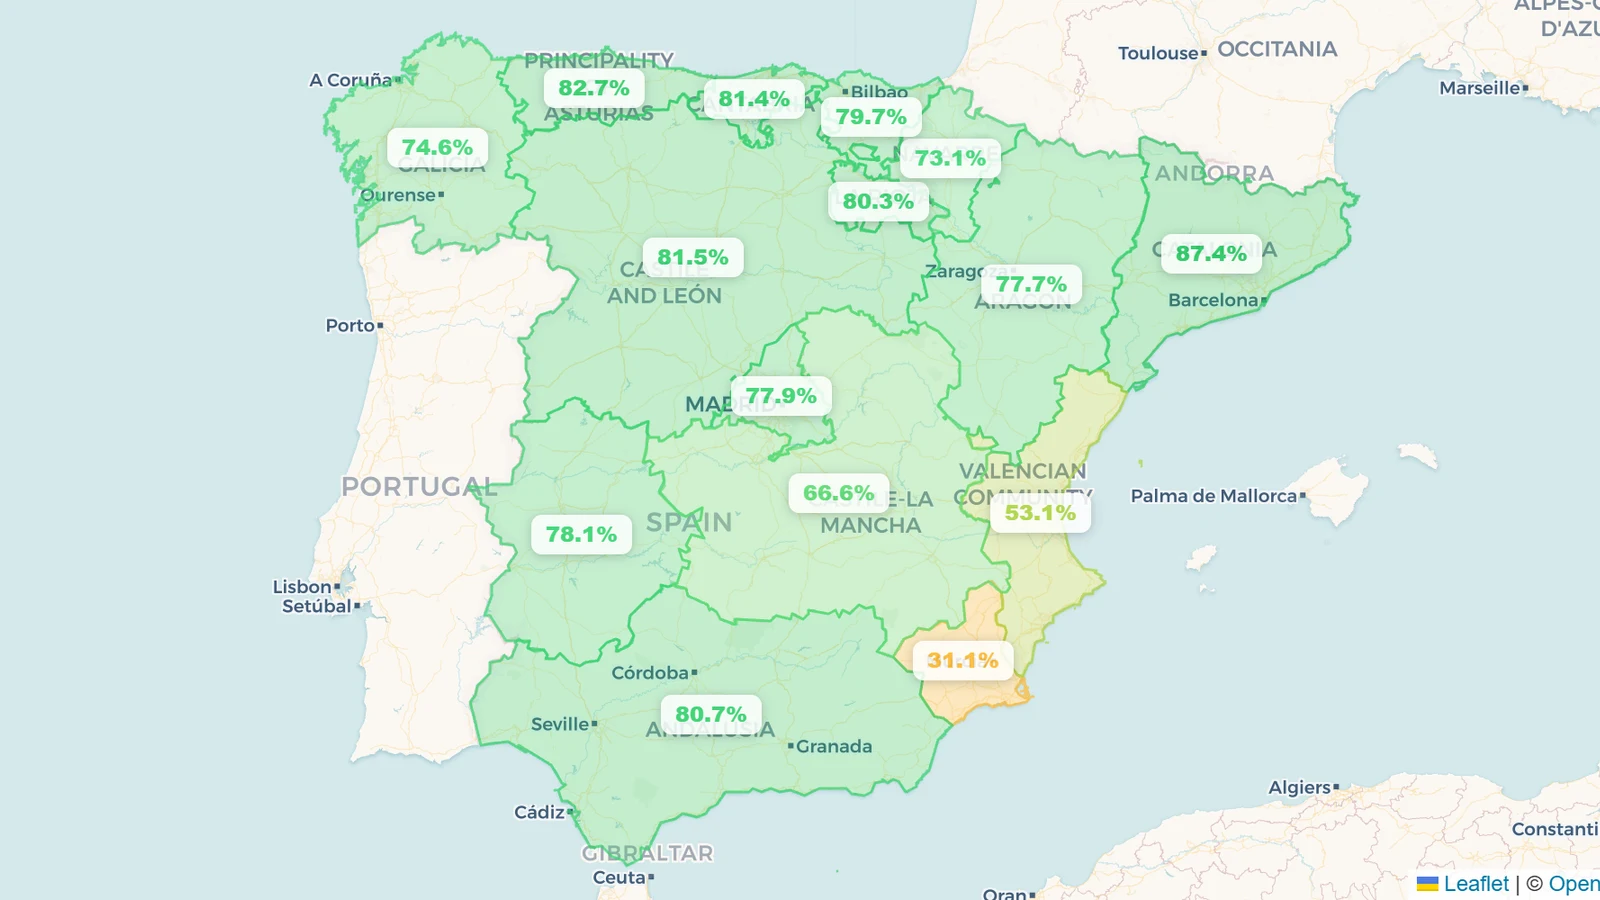
Spain's reservoirs are about 77% full in mid-July 2026 — roughly 43.2 of 56.5 km³ across the 374 reservoirs in the national bulletin, and well above the ~60% ten-year July average, about 6 points up on a year ago. The drought that gripped the peninsula from 2022 to 2024 has decisively reversed: every major river basin is above 58% full, and the Atlantic-draining west and centre are brimming. Even the historically driest corner, the Mediterranean southeast (Segura ~58%, Júcar ~63%), is only relatively low, while Catalonia — under emergency restrictions in early 2024 — is back to about 88%. As of the 6 July 2026 reading, the story is not scarcity but an unusually comfortable summer starting point.
Nevada Reservoir Levels, July 2026: 29% Full, and That's Almost Entirely Lake Mead
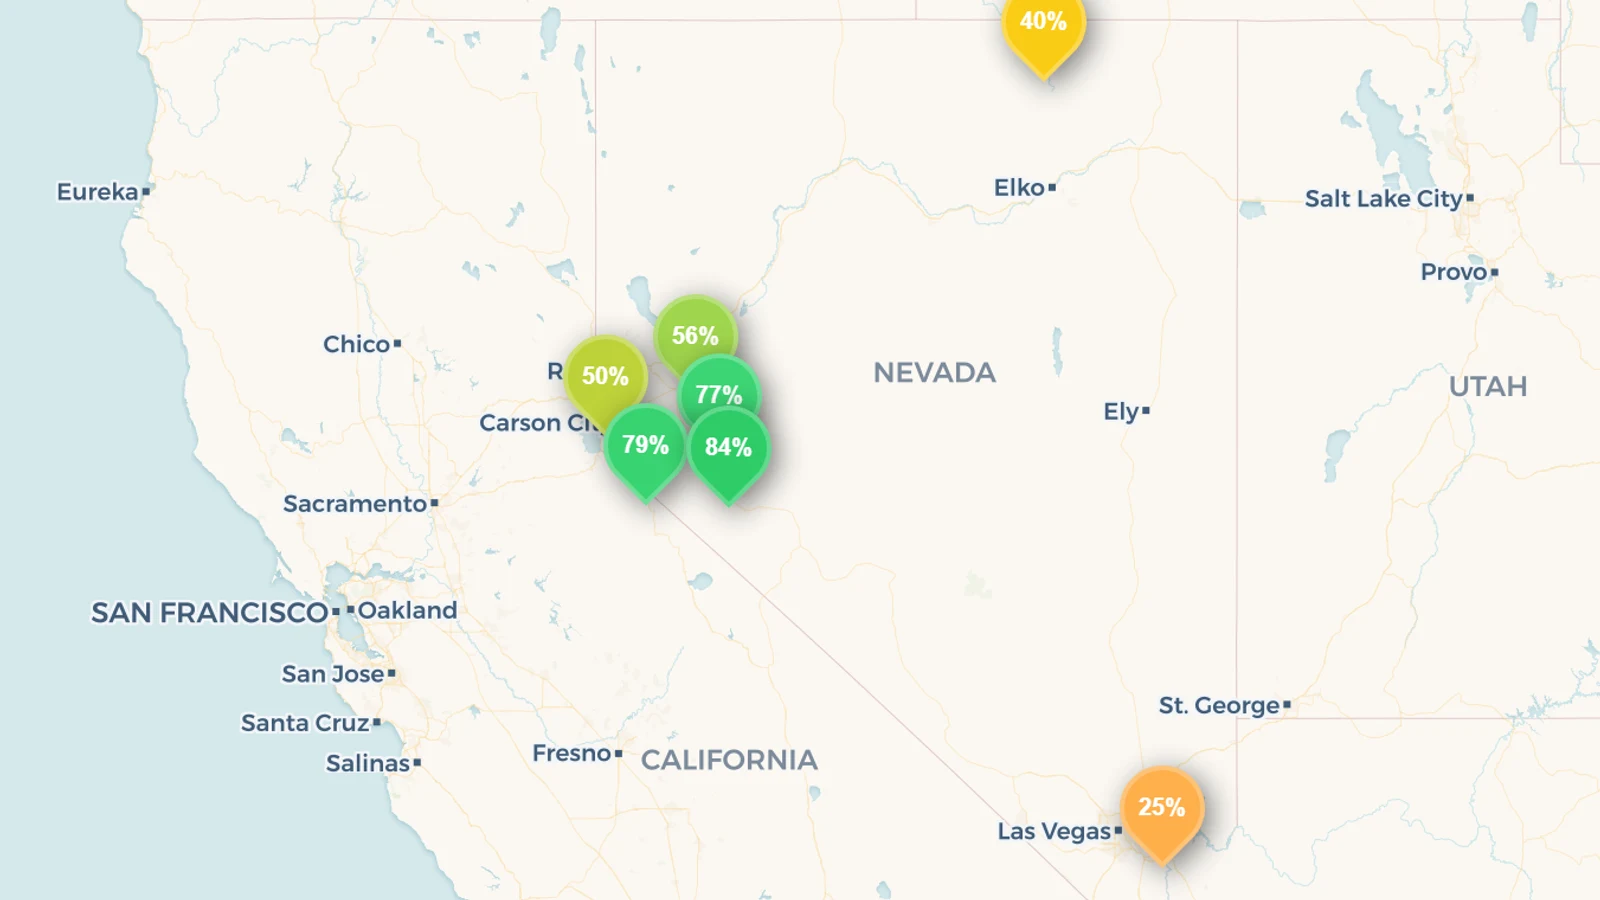
Nevada's tracked reservoirs read about 29% full in mid-July 2026 — near the bottom of everything we track, second only to New Mexico. But almost the entire figure is one reservoir: Lake Mead, the Colorado River giant behind Hoover Dam, holds about 94% of the state's tracked capacity and sits at just 25.4% on 11 July — effectively tied with 2022 for its lowest early-July reading in five years. Strip Mead out and the rest of Nevada averages about 77%, yet five of the seven reservoirs we track are below their mid-July normal, and Wild Horse in the northeast has fallen from 88% to 40% in a single year. Same Colorado River water Arizona depends on, filed in Nevada's column — which is why Nevada reads 29% and Arizona reads 84%.