
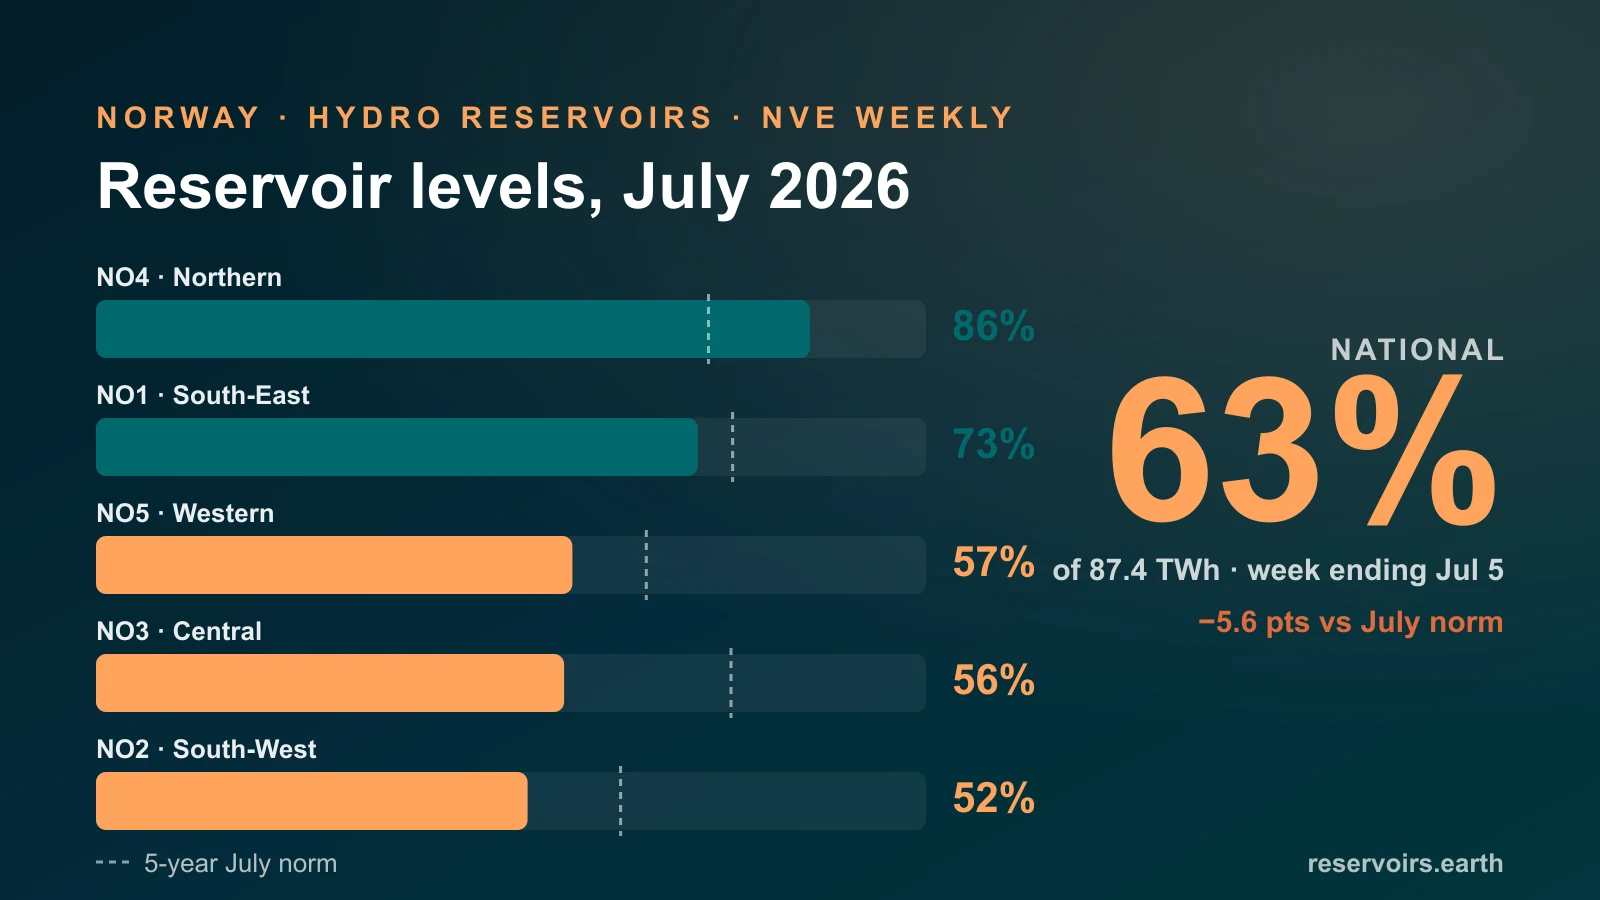
Norway's hydropower reservoirs are 63% full as of July 5, 2026 — about 5.6 points below the five-year early-July average of 68.6%, and the country's second-lowest early-July reading since 2022. The headline number hides a sharp split: Northern Norway (NO4) is sitting at 86%, a full 12 points above its July norm, while the big export-facing south is running lean — South-West Norway (NO2), the largest storage area in the country, is at 52% against a July norm of 63.2%, and Central Norway (NO3) has fallen from 87.1% a year ago to 56.4% today, a 31-point year-on-year drop. Because Norway measures its reservoirs in energy rather than water — the national system stores 55,073 GWh of a possible 87,438 GWh — these percentages are, quite literally, the level of Northern Europe's battery. Live figures for all five price areas are on the Norway page.
Key takeaways
- Norway's reservoirs are 63% full (July 5, 2026) — below the 68.6% five-year July average and the second-lowest early-July level since 2022 (59.4%). Live data on the Norway page.
- The south is lean, the north is full. NO2 South-West is at 52% (norm 63.2%) and flat week-on-week while every other area rose; NO4 Northern is at 86%, 12 points above normal.
- Central Norway has the sharpest fall: 87.1% → 56.4% in one year. NO3 went from the fullest July in its recent record to 20 points below its norm.
- July is mid-refill, not the peak. Norwegian reservoirs bottom out near 34% in April and keep filling to an October–November peak near 78%, so the snowmelt season still has months to run — but a below-normal July starts the autumn from behind.
- These are energy numbers, not just water numbers. Norway's 87.4 TWh of reservoir capacity is the storage behind Northern Europe's power market; NVE, the source of this data, notes it amounts to roughly half of Europe's reservoir storage.
Where the data comes from
Norway is one of the most transparent reservoir systems we track — and one of the most unusual. The regulator NVE (Norges vassdrags- og energidirektorat) publishes Magasinstatistikk, a weekly statistical series of reservoir levels aggregated by the five electricity price areas (NO1–NO5), measured in stored energy (GWh) rather than cubic metres. There are no individual reservoir gauges in the public weekly series — the price area is the unit, because in Norway the reservoir system is the power system. reservoirs.earth mirrors that weekly series, keeps the multi-year history, and rolls it up to the national figure; each area's chart is on its own page (NO1, NO2, NO3, NO4, NO5). Readings are week-ending Sundays; the figures below are for the week ending July 5, 2026. Our sourcing and freshness rules are on the methodology page, and Norway's openness is scored in the Reservoir Transparency Index.
The current picture (week ending July 5, 2026)
| Price area | Fill | Week change | A year ago | July norm (5-yr) |
|---|---|---|---|---|
| NO1 South-East | 72.5% | +0.6 | 66.5% | 76.7% |
| NO2 South-West | 52.0% | 0.0 | 60.3% | 63.2% |
| NO3 Central | 56.4% | +2.0 | 87.1% | 76.5% |
| NO4 Northern | 86.0% | +2.1 | 84.8% | 73.8% |
| NO5 Western | 57.4% | +1.8 | 64.2% | 66.3% |
| National | 63.0% | +1.1 | 69.9% | 68.6% |
Two things stand out in that table. First, the spread: 34 points separate the fullest area from the emptiest, and the deficit is concentrated in the south and centre while the north runs a surplus. Second, the week-on-week column: four of five areas are still filling, as they should be in early July — but NO2, the largest area and the one already furthest below normal, added nothing at all this week.
Why a below-normal July matters in a country that peaks in October
Norway's reservoir calendar is the mirror image of a snowmelt-irrigation system like Colorado's, where early July is the annual maximum. Norwegian reservoirs are drawn down through the heating winter to an April low around 34%, then refill on snowmelt and summer inflow to an October–November peak near 78%. Early July is roughly the midpoint of that climb.
That cuts both ways. The reassuring reading: there are still three to four months of filling season left, and a 5.6-point national deficit is recoverable with a wet late summer — 2022 started July at 59.4%, lower than today. The cautious reading: the areas that are behind are behind at the moment they should be catching up fastest, and NO2's flat week in early July is the kind of detail the autumn is built from. What the reservoirs hold in November is what Norway — and its neighbours — heat with in February.
The north–south split is a power-price map
The five areas in this data are not administrative regions; they are the bidding zones of the Nordic electricity market, and the cables between them are congested precisely when storage diverges like this. NO4 Northern at 86% is 12 points above its norm and near the top of its recent range — but the north is also the area least connected to the continent. NO2 South-West is the opposite case: it holds the country's largest storage (34,044 GWh of capacity, more than a third of the national total) and hosts the interconnectors to Germany, the UK, Denmark and the Netherlands, which makes its 52% the single most consequential number in this table for anyone watching Northern European power this winter.
We publish reservoir data, not price forecasts — but the storage picture is the physical input that market participants read, and this July it reads: the exporting south has less in the tank than normal, and the well-stocked north can only ship so much of its surplus across the internal grid.
Central Norway's 31-point fall
The sharpest single change in the table is NO3 Central: 87.1% a year ago, 56.4% today. A year ago the area was carrying an unusually full store — well above its July norm of 76.5% — and this year it sits 20 points below that norm. The swing from "fullest recent July" to "furthest below normal in a single year" is the widest one-year move of any area in our five-year record, and it means the centre enters the autumn with the most ground to make up relative to its own history.
What reservoir levels do — and don't — tell you here
- The unit is energy. Norway reports GWh, not cubic metres, so a percentage here is a share of storable electricity. That makes the number unusually meaningful — and means it shouldn't be compared directly with the volumetric percentages of, say, Spain or the United States.
- Timing changes the meaning. 63% in July is mid-climb; 63% in November would be a very different story. Watch the gap to the norm, not the raw level: it is the deficit (−5.6 nationally, −11 in NO2) that persists through the calendar.
- Area aggregates hide nothing here — by design. In most countries a regional average blends dozens of reservoirs with different jobs. Norway's public series is the aggregate, published that way by the regulator; there are no individual gauges to cherry-pick, which is part of why its transparency scores the way it does.
- One week is noise; the trend is signal. These are weekly readings. NO2's flat week matters because it lands on top of an 11-point deficit — not on its own.