Colorado's tracked reservoirs are about 60% full at the start of July 2026 — a figure that sounds middling until you realize when you are reading it. Early July, just after the snowmelt has run off the peaks, is the annual high-water mark: it is the fullest these reservoirs will be all year, and from here they only fall through the irrigation summer. So 60% is not a mid-season number that might still climb — it is roughly the ceiling for 2026. And beneath it, the strain is concentrated where it matters most: the large majority of the Colorado reservoirs we track are already below their normal early-July level, including the ones at the very top of the Colorado River. Blue Mesa, the largest reservoir wholly inside the state, is at 39% against a July norm near 72%. Colorado is where the West's biggest rivers are born, and in 2026 they are starting the summer short. Live figures are on the Colorado page; the national picture is on the United States page.
Key takeaways
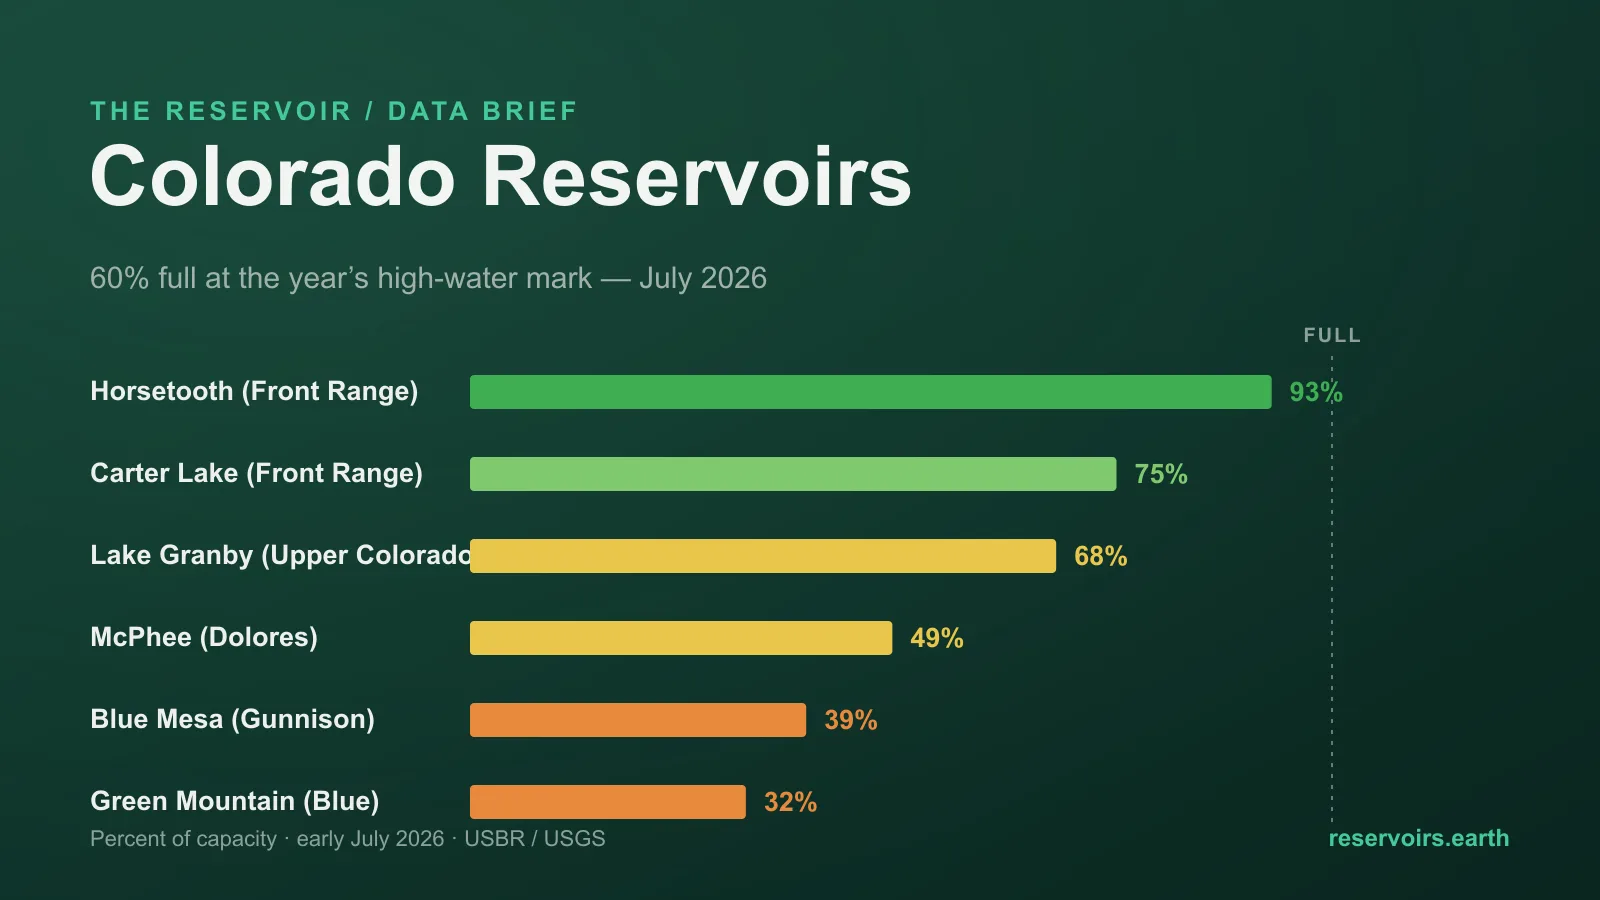
- ~60% full is the year's high-water mark, not a mid-season reading. Colorado's reservoirs peak in early July after snowmelt and decline from there, so this is about as full as 2026 gets. Live figures are on the Colorado page.
- Most reservoirs are below normal at their fullest moment. The large majority of those we track sit under their early-July norm after one of the lowest snowpacks on record across the state.
- The Colorado River headwaters are the weakest spot. Blue Mesa (Gunnison) is ~39%, Green Mountain (Blue River) ~32%, and Lake Granby (upper Colorado) ~68% — all near five-year July lows.
- The Front Range delivery reservoirs are the exception. Horsetooth (
93%) and Carter Lake (75%) are held up by trans-mountain water and municipal management, so they read far fuller than the West Slope storage reservoirs.
- This is a source-basin story. The water in these reservoirs is the water that Arizona, Nevada, California and Texas argue over downstream — Colorado's snow deficit becomes their shortage a year later.
Where the data comes from
Colorado is one of the most plumbed states in the country — rivers are diverted under the Continental Divide to the Front Range cities — and its reservoirs come from several federal operators. The US Bureau of Reclamation runs the big Colorado River Storage Project and Fryingpan–Arkansas reservoirs (Blue Mesa, Green Mountain, Ruedi, Pueblo, Turquoise and more); the Colorado–Big Thompson delivery reservoirs (Granby, Horsetooth, Carter Lake) come from Reclamation too, and the US Geological Survey gauges many of the smaller West Slope reservoirs. reservoirs.earth mirrors those gauges, adds multi-year history, and rolls them up by state. Every figure below is dated, because levels change daily; the live numbers and each reservoir's chart are on the Colorado page and each reservoir's own page.
Why "60% in July" is worse than it sounds
In most of the country, a reservoir's calendar has a low point in early spring and a high point in early summer, once the snow has melted and run into storage. Colorado is a strong version of this: its reservoirs are fed by mountain snowpack, so they fill fast in May and June and then draw down all summer for irrigation and downstream delivery. That makes early July the peak of the year — the moment of maximum storage.
Which is exactly why 2026's reading is a concern rather than a shrug. A reservoir at 60% in April might still be filling; a reservoir at 60% at the July peak has already collected essentially all the water it is going to get this year, and the only direction left is down. When the large majority of the reservoirs we track are below their normal July level, they are below normal at the best moment on their calendar. The snowpack that should have topped them off never fully arrived: state and federal snow surveys reported one of the lowest peak snowpacks on record across Colorado this year, with the melt arriving weeks early. Reservoir storage is now cashing that deficit.
The current picture (as of early July 2026)
The West Slope — the Colorado River headwaters, where the shortfall is sharpest:
| Reservoir |
River / role |
Fill |
Normal (early Jul) |
| Blue Mesa |
Gunnison — major storage |
39% |
~72% |
| Green Mountain |
Blue — storage |
32% |
~86% |
| McPhee |
Dolores — storage |
49% |
~69% |
| Lake Granby |
Upper Colorado — storage |
68% |
~96% |
| Ruedi |
Fryingpan — storage |
71% |
~92% |
| Turquoise |
Arkansas transbasin |
72% |
~89% |
The Front Range and Arkansas side — held up by delivery management:
| Reservoir |
River / area |
Fill |
Normal (early Jul) |
| Horsetooth |
Colorado–Big Thompson (delivery) |
93% |
~92% |
| Carter Lake |
Colorado–Big Thompson (delivery) |
75% |
~89% |
| Twin Lakes |
Arkansas transbasin |
66% |
~86% |
| Pueblo |
Arkansas |
58% |
~66% |
| Vallecito |
Los Pinos (SW) |
68% |
~74% |
The split is not geographic in the simple north/south way Texas is — it is functional. The reservoirs that store native West Slope runoff are low because the runoff was low. The reservoirs that receive water piped over the divide to the Front Range cities, like Horsetooth, are kept fuller because they are filled to a municipal delivery target rather than left to rise and fall with a single basin's snow. A near-full Horsetooth and a 39% Blue Mesa in the same state are not a contradiction; they are two different jobs.
Five straight Julys, all trending down
The high-water-mark point is clearest in the multi-year record. Here is early-July fill for four of Colorado's key storage reservoirs across five years:
Every one of these four is at its lowest early-July level in the five-year record. The contrast with 2023 and 2024 — when the same reservoirs sat at or near full at this point in the summer — is what a single bad snow year looks like when it lands on top of an already-tight basin. Lake Granby alone fell from a routine ~97% to 68% in one year.
The water everyone downstream is counting on
Colorado's reservoir levels are not only a Colorado story. This state is the headwaters of the Colorado River, the Rio Grande, the Arkansas and the South Platte — four rivers that supply, between them, a large share of the interior West and Southwest. The snow that doesn't fall here, and the reservoirs that don't fill here, become next year's shortage somewhere else:
- The Colorado River, born on the West Slope, flows to Lake Powell and Lake Mead and on to Arizona, Nevada, California and Mexico. A dry year in the Colorado headwaters is the ultimate source of the low Mead and Powell that define the Lower Basin.
- The Rio Grande rises in the San Juan Mountains of southern Colorado and runs into New Mexico and Texas, where Elephant Butte sits near empty.
That is what makes a Colorado high-water-mark reading worth watching beyond the state line: it is an early read on how much water the whole system will have to divide next year.
A caveat on the reservoirs that read full
As always, a level only means something once you know the reservoir's job. A few of Colorado's fullest gauges are not weather signals. Morrow Point on the Gunnison reads in the mid-90s because it is a run-of-river power-and-regulating reservoir held near a constant level, not a storage reservoir that rises and falls with drought — the same kind of "always full by design" reading that makes Arizona's regulating reservoirs misleading. And the Front Range delivery reservoirs are managed to a supply target. Read those as operations, and read Blue Mesa, Green Mountain and the West Slope storage reservoirs as the drought.
What reservoir levels do — and don't — tell you here
- Timing changes the meaning. The same percentage means different things in April and July. Colorado's reservoirs are near their annual peak in early July, so a below-normal reading now cannot be made up later this year — the filling season is over.
- "Full" can be a delivery decision. The Front Range reservoirs are kept high by trans-mountain diversion and municipal operation, not because the local basin is wet. The reservoirs that honestly track Colorado's snow are the West Slope storage ones, and those are low.
- Storage is a one-year memory; the river is longer. These levels reflect this winter's snow. But because Colorado feeds the big downstream reservoirs, its dry years compound into the multi-year deficits you see in Powell and Mead, which no single good winter resets.
What it means for the summer
The practical read for 2026: Colorado enters the summer having already banked most of the water it will get this year, and it is a below-normal amount almost everywhere the snow actually feeds the reservoirs. Front Range cities, drawing on managed delivery reservoirs and having leaned into watering restrictions this spring, have a cushion; West Slope agriculture and the recreation economy on reservoirs like Blue Mesa — where low water closes boat ramps and shortens the season — are the ones feeling the shortfall now. And every reservoir here will decline from this July peak through the fall, which is normal, but starts from a lower point than usual.
The honest summary: about 60% full at the one moment of the year it should be fullest, with the Colorado River headwaters near five-year lows — a source-basin running short, which is the West's problem a year before it is anyone else's.
FAQ
What are Colorado's reservoir levels right now?
About 60% of capacity statewide as of early July 2026, with the large majority of the reservoirs we track below their normal early-July level. Because early July is the annual peak after snowmelt, that is roughly the fullest they will be all year. Live figures are on the Colorado page.
Why does 60% in July matter more than 60% earlier in the year?
Colorado's reservoirs are fed by snowmelt and peak in early summer, then draw down through the irrigation season. A reading at the July peak is essentially the ceiling for the year, so below-normal now cannot be recovered later in 2026 — unlike a spring reading, which might still be rising.
Which Colorado reservoirs are lowest?
Among the major storage reservoirs, Green Mountain (32%), Blue Mesa (39%) and McPhee (~49%) are the most depleted relative to their normals. The Front Range delivery reservoirs like Horsetooth read much fuller because they are managed to a supply target.
How does Colorado affect Arizona, California and Texas?
Colorado is the headwaters of the Colorado River (which feeds Powell, Mead and the Lower Basin states) and the Rio Grande (which feeds New Mexico and Texas). A low snow-and-storage year in Colorado becomes reduced water availability downstream, typically the following year.
Where does the data come from?
The US Bureau of Reclamation for the big Colorado River Storage Project, Colorado–Big Thompson and Fryingpan–Arkansas reservoirs, and the US Geological Survey for many smaller ones, mirrored with multi-year history on reservoirs.earth.
This is a July 2026 snapshot of Colorado; for the national picture and where drought risk actually sits across the US, see the US reservoir levels edition and the downstream Arizona, New Mexico and Texas editions. How US water-data openness ranks is on the Reservoir Transparency Index.