"Which US states are at risk of drought?" is a different question from "which reservoirs are lowest" — and in June 2026 the two answers point in different directions. Nationally, US reservoirs are about 66% full, only around 4 points below their typical June level — modestly dry, not alarming. But the drought-risk signal is regional and counterintuitive. The famous low reservoir, Lake Mead, is near its recent normal — it has been low for two decades. The reservoirs that have actually dropped below where they usually sit in June are upstream and to the north: the Snake River in Idaho, the Upper Colorado Rockies, and a notably dry Mississippi. Meanwhile California — the state everyone associates with drought — is above its normal. The live national figure and state map are on the United States reservoir levels page.
Key takeaways
- Nationally, storage is about 66% of capacity — roughly 4 points below the typical June level. A mild deficit, not a crisis. The live figure is on the United States page.
- Low ≠ drought risk. Lake Mead is at 26%, but that is only about 2 points below its recent June average — it has sat near this level for years. The acute drop is elsewhere.
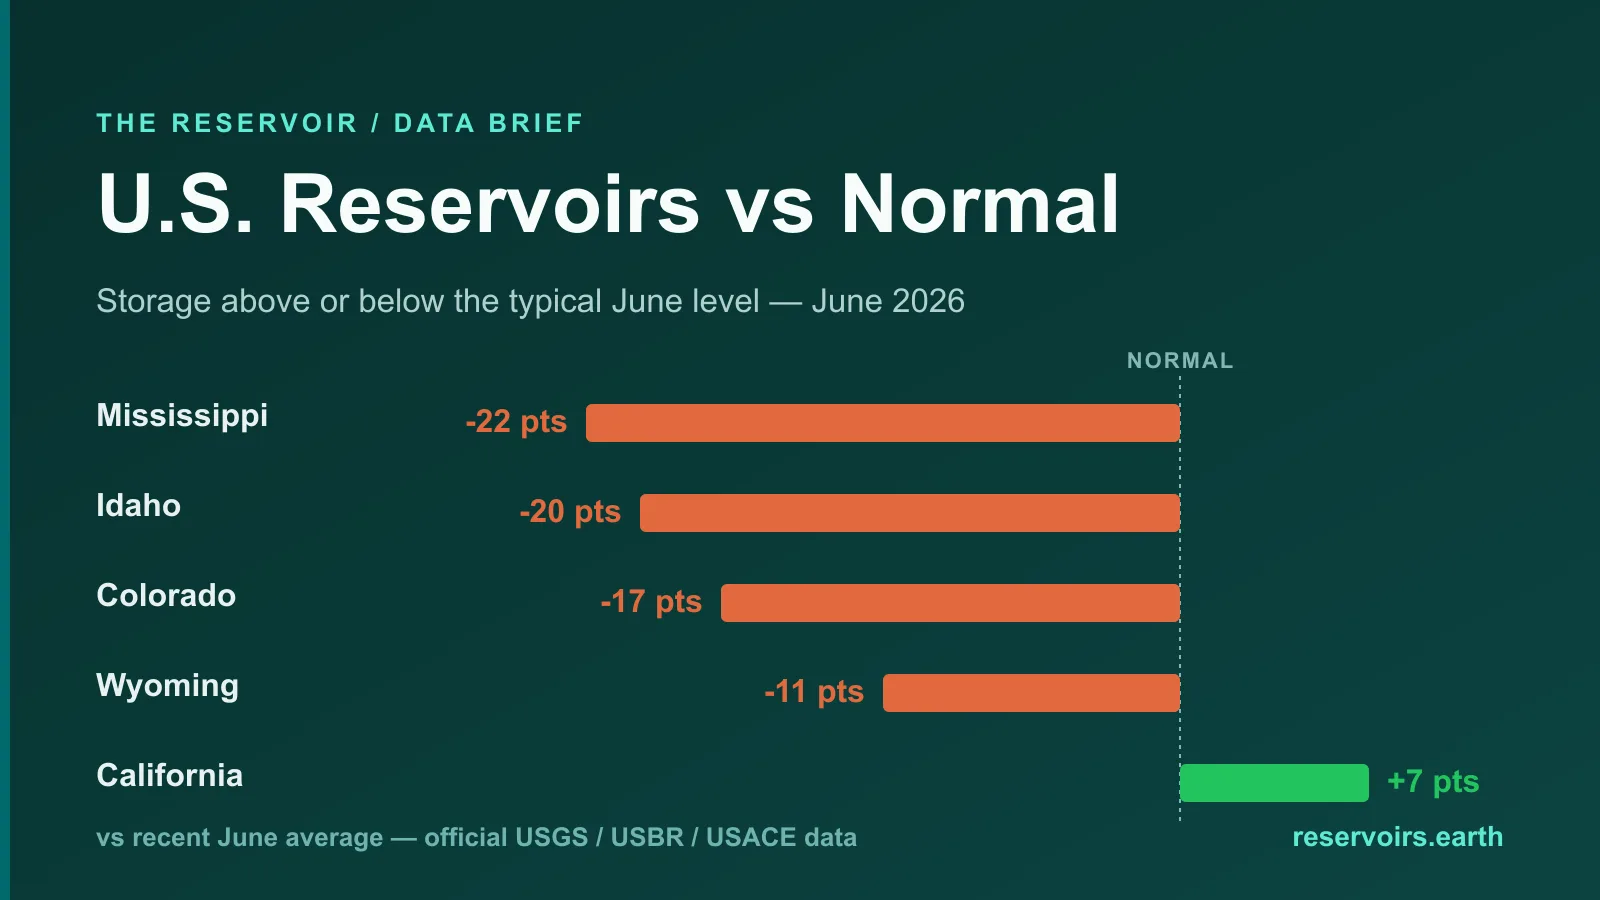
- The states most below their normal June level are Mississippi (about 22 points low), Idaho (20), Colorado (17), Wyoming (11), North Dakota (10) and Utah (9).
- Idaho's Snake River is the sharpest signal: Palisades is about 35 points below its June norm and American Falls about 29 — both entering the irrigation season much lower than usual.
- California is above normal (about 7 points), and Kansas and Iowa are wetter than usual too — a reminder that "US drought" is never one map.
How we measure drought risk here
There are two ways to read a reservoir, and they answer different questions:
- Absolute fill ("Lake Mead is 26% full") tells you how much water is in the tank. It is the right number for supply, but a reservoir can be permanently low — over-allocated, or a flood-control pool kept empty by design — without that being news.
- Anomaly ("Lake Mead is 2 points below its recent June average") tells you whether this year is worse than usual for the season. That is the better read on emerging drought risk.
This piece uses the second lens. For every reservoir with a current reading, we compare today's fill to its own average for this month across recent years, then roll it up by state, capacity-weighted. (Two caveats: our "normal" is a recent multi-year June average, not a 30-year climatology; and comparing a reservoir to its own June norm automatically handles flood-control storages, whose norms already reflect their empty-pool operation.) The underlying data comes from the USGS, the Bureau of Reclamation, the Army Corps of Engineers and CDEC, mirrored on the United States page.
The national picture
The reservoirs we track hold about 339 km³ of capacity and, as of 19 June 2026, were storing about 225 km³ — close to 66%, a capacity-weighted average across the 446 reservoirs currently reporting. That is roughly 4 points below the typical June level of around 70%. So the country as a whole is a little drier than normal for the season — enough to watch, not enough to alarm. The interesting part is how unevenly that deficit is distributed.
The famous low reservoir isn't the drought story
The reservoir people picture when they hear "US drought" is Lake Mead, and it is genuinely low at 26% of capacity. But it is only about 2 points below its recent June average — the Colorado River has been over-allocated and running short since 2000, so Mead's "normal" is already a low number, and 2026 is close to it. It is a chronic condition, not an acute one.
The Colorado's upstream half is the part that has slipped this year. Lake Powell is about 9 points below its June norm (23% versus a typical 32%), and the upper-basin storages that feed it — Flaming Gorge and Navajo — are each several points down. That matters downstream: Mead stays stable only as long as the upper basin keeps passing water to it. On the Rio Grande, Elephant Butte is both chronically low (6%) and about 8 points below its June norm.
The states actually below normal
Ranked by how far each state's capacity-weighted storage sits below its typical June level (mid-June 2026):
- Idaho — about 20 points below normal. The clearest drought signal in the country. The Snake River irrigation reservoirs Palisades (about 35 points low) and American Falls (about 29) are entering the growing season far lower than they normally would.
- The Upper Colorado Rockies — Colorado (17), Wyoming (11), Utah (9). A weak snowpack-and-runoff year across the headwaters of the Colorado and Green rivers — the water that eventually reaches Powell and Mead.
- The northern Plains — North Dakota (10) and Minnesota (9). Even the big, normally-full upper-Missouri systems are down: Garrison and Red Lake are each about 11 points below their June average.
- Mississippi — about 22 points below normal, the largest state deficit, though across a small set of reservoirs — a regional dry spell in the lower Mississippi valley worth watching rather than a national headline.
- The Southwest — New Mexico and Arizona (about 7 each). Low in absolute terms, and modestly below normal on top of that.
And the states that are wetter than usual
Drought risk is never the whole map. California is about 7 points above its June norm (83% full) after a run of wet years — the opposite of its 2021–22 reputation. Kansas (about 8 points above), Iowa and Washington are also running at or above normal. The eastern and central reservoir systems — the Ohio and Tennessee valleys — are near their usual high levels.
What "below normal" means — and what it doesn't
- It is a seasonal comparison, not a doom number. A state 20 points below its June norm can still be 58% full (Idaho); the point is that it is lower than it usually is at this time of year, which is the early-warning signal.
- "Normal" here is a recent multi-year average, built from the history we hold, not a long climatological record — so read it as "drier than the last few Junes," not "driest on record."
- The upstream signal leads the downstream one. A dry Upper Colorado and Snake River in June is information about late-summer flows, irrigation allocations, and next year's Powell and Mead — which is why the headwaters matter more than the headline reservoir.
Why it matters
Reservoir storage is the buffer between a dry winter and a hard summer. The places below normal this June are mostly irrigation and headwater systems — the Snake River, the Upper Colorado — where a below-average June sets up tighter water allocations for farms and a thinner cushion for the big downstream reservoirs later in the year. The anomaly map is the early read on where that squeeze is most likely. We will track it month by month; the question for July is whether these deficits deepen or the summer holds them steady.
FAQ
Which US states are at risk of drought in 2026? By how far storage sits below its normal June level, Idaho, Colorado, Wyoming, Utah and North Dakota are the clearest signals, with Mississippi showing the single largest deficit across a small set of reservoirs. The live map is on the United States page.
Are US reservoir levels concerning compared with other years? Nationally, only mildly — about 66% full, roughly 4 points below the typical June level. The concern is regional: the Snake River and Upper Colorado are well below their recent June averages, while California is above normal.
Is Lake Mead at risk this year? Lake Mead is low (26%) but close to its recent June average — a chronic, not a new, problem. The more notable change this year is upstream at Lake Powell, about 9 points below its June norm.
Isn't California always the drought state? Not in 2026. After several wet years, California is around 83% full, about 7 points above its normal June level — one of the wetter major states right now.
Where does the data come from? Official US agencies — the USGS, the Bureau of Reclamation, the Army Corps of Engineers and California's CDEC — mirrored and given multi-year history on the United States page.
This is the June 2026 drought-risk read; for the full picture of US reservoirs and how the data fits together, see the United States reservoir levels explainer. We track the major water economies month by month — see the India and Australia editions, and how US openness ranks on the Reservoir Transparency Index.