Across the roughly 600 major reservoirs we track in 37 US states, storage sits at about 65% of combined capacity as of mid-June 2026 — but that single number hides a sharp split. The arid Southwest is running near-empty while the northern Plains and a rain-fed California are close to full. The states carrying the least water relative to capacity are Nevada, New Mexico and Utah, and the most stressed large reservoirs are all on the Colorado River and Rio Grande: Elephant Butte, Lake Powell and Lake Mead. The live national figure and the full map are on the United States reservoir levels page.
Key takeaways
- National storage is about 65% of capacity (mid-June 2026), but that average is misleading. Two giant Colorado River reservoirs — Lake Mead and Lake Powell — hold almost a fifth of all US reservoir capacity between them and sit near 25%, dragging the headline down.
- The driest states by capacity-weighted fill are Nevada (30%), New Mexico (30%) and Utah (33%) — the heart of the Colorado River Basin and the Rio Grande.
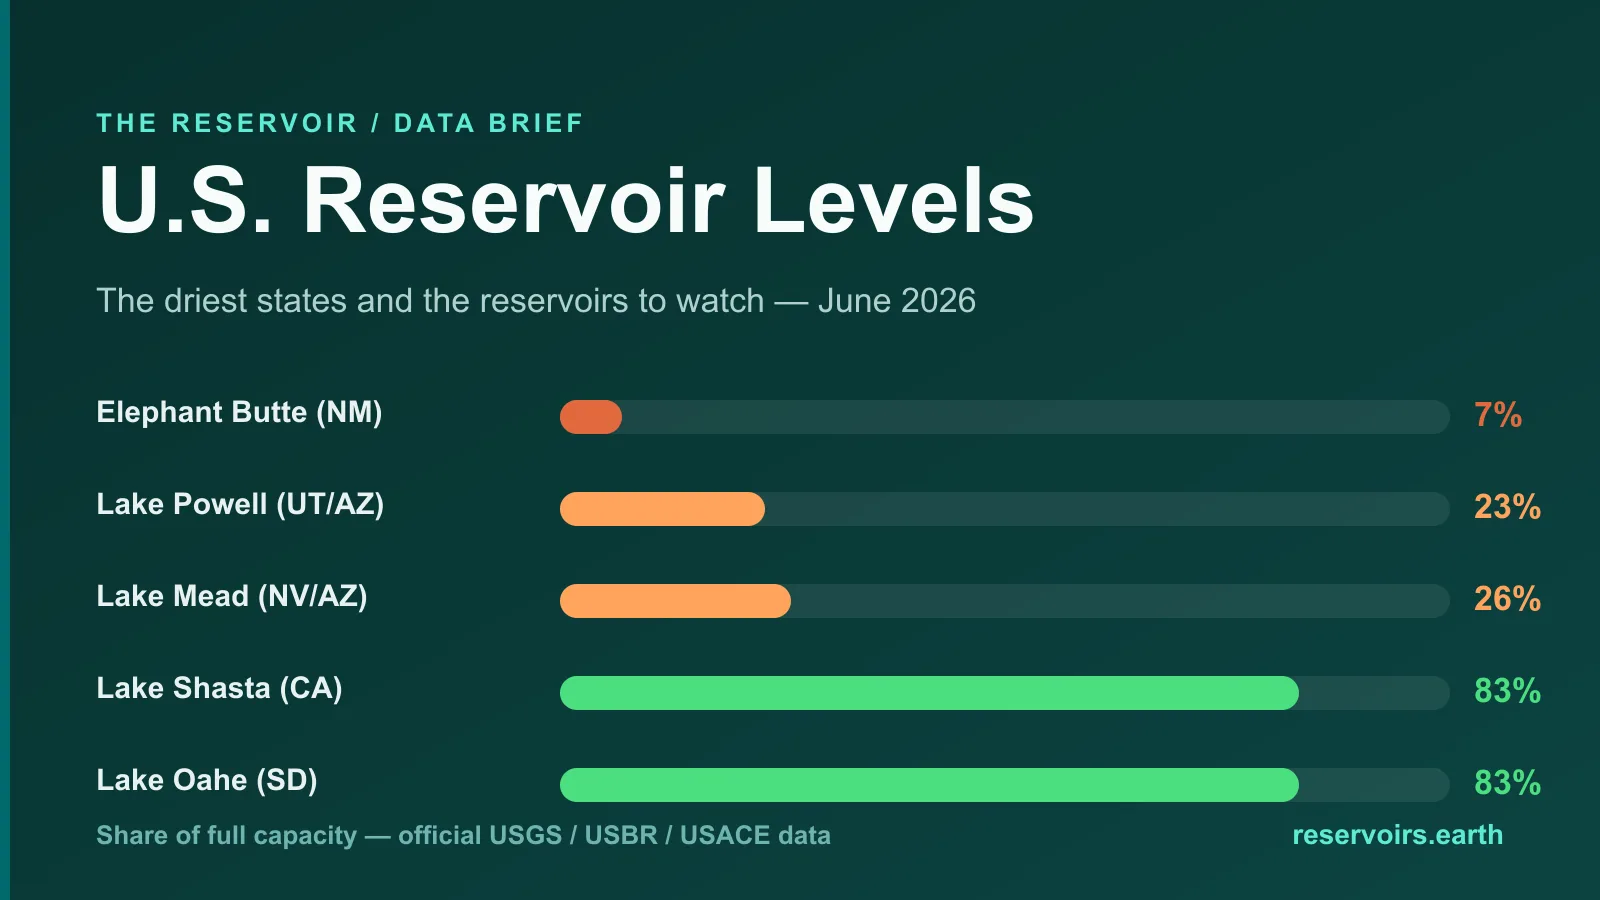
- The single most depleted large reservoir is Elephant Butte on the Rio Grande, at roughly 7% of capacity. Lake Powell (23%) and Lake Mead (26%) are the largest reservoirs in the country and both sit around a quarter full.
- It is not all drought. The upper Missouri River reservoirs — Lake Oahe, Garrison and Fort Peck — and California's biggest, Shasta and Oroville, are all above 80%.
- A low percentage is not always a drought signal. Many Army Corps reservoirs keep large flood-control pools deliberately empty, so read the trend and the season on each reservoir's page, not just the headline number.
Where US reservoir data comes from
The United States is one of the most transparent countries in the world for water data — it scores highly on the Reservoir Transparency Index precisely because the numbers are public, frequent and machine-readable. There is no single national bulletin; instead, several federal and state agencies publish their own measurements:
- The U.S. Geological Survey (USGS) National Water Information System publishes near-real-time gauge data.
- The Bureau of Reclamation (USBR) operates and reports the big western storage reservoirs, including Mead, Powell and Shasta.
- The U.S. Army Corps of Engineers (USACE) runs the large flood-control and navigation reservoirs on the Missouri, Ohio and other river systems.
- California's CDEC network reports the state's major reservoirs daily.
reservoirs.earth pulls these official readings together, adds multi-year history, and rolls them up by state and nationally on the United States page. Each reservoir keeps its own page with the latest reading and the trend.
The national picture
The major US reservoirs we track hold a combined full capacity of roughly 340 km³ (about 340 billion m³). As of mid-June 2026 they are holding around 223 km³ — close to 65% of capacity — as a capacity-weighted average. That weighting is the whole story: a single large reservoir moves the national figure far more than dozens of small ones.
Here is why the headline understates how full most of the country is. Lake Mead (capacity 34.9 km³, the largest reservoir in the United States) and Lake Powell (30.9 km³, the second-largest) together account for nearly a fifth of all the reservoir capacity in the dataset — and both sit near 25% full. Strip those two out and the rest of the country looks markedly healthier. The national number is, to a large degree, a Colorado River number.
The driest states
Ranked by capacity-weighted fill (states with at least a few sizeable reservoirs), the bottom of the table is dominated by the Southwest and the Rio Grande, as of mid-June 2026:
The common thread for the genuinely water-stressed states is the Colorado River Basin and the Rio Grande — a structurally arid region where demand has outrun supply through more than two decades of low flows. Read each state's live figure and its reservoir list on its page; the rankings shift with the season and the snowmelt.
The most concerning reservoirs
These are the large reservoirs (capacity above 2 km³) holding the least water relative to capacity, as of mid-June 2026. Each links to its live page with the latest reading and full history:
- Elephant Butte Reservoir — Rio Grande, New Mexico. 7% of capacity. The starkest example of the Rio Grande's long decline.
- Lake Powell — Colorado River, Glen Canyon Dam. 23%, capacity 30.9 km³. The upstream half of the Colorado's storage problem.
- Lake Mead — Colorado River, Hoover Dam. 26%, capacity 34.9 km³ — the largest reservoir in the United States and the supply backbone for Las Vegas, Arizona and Southern California.
- Harry S. Truman Reservoir and Mark Twain Lake — Missouri. Around a third full, but these are flood-control reservoirs whose low summer level is partly by design.
- American Falls — Snake River, Idaho. Below 50%, an irrigation reservoir that is normally drawn down hard through the growing season.
By contrast, the country's other giants are in good shape: the upper Missouri's Lake Oahe, Garrison and Fort Peck are all around 80%+, and California's Shasta and Oroville are well above 80% after wet years. The crisis is regional, not national.
What "% full" actually means — and the flood-control trap
A reservoir's level is reported as a percentage of its total (or full-pool) capacity — the volume it holds when filled to its design level. So 26% full means the reservoir is holding about a quarter of its design storage.
Two things mislead people. First, a capacity-weighted national or state average is pulled toward the biggest reservoirs, so Lake Mead and Lake Powell effectively set the Southwest's number. Second — and this is the one most readers miss — many US reservoirs run by the Army Corps of Engineers are flood-control projects, designed to sit with a large empty pool most of the year so they can absorb a flood. A Corps reservoir at 35% in June is often doing exactly what it was built to do, not signalling drought. That is why the trend and the seasonal comparison on each reservoir's page matter more than a single percentage.
Why US reservoir levels matter
The Colorado River system alone supplies water to roughly 40 million people across seven states and Mexico, plus a vast irrigated agriculture sector, and its two big reservoirs generate hydropower at Hoover and Glen Canyon dams. When Mead and Powell fall, the questions are concrete: how much water each state can draw, whether the dams can still spin their turbines, and how close the system is to the "dead pool" level at which water can no longer pass downstream. Those are the structural concerns that have driven a decade of interstate negotiation over the river.
That is the case for keeping this data open and current. The United States already does — which is why you can read any of these reservoirs live rather than waiting for an annual report. Track the whole country on the United States reservoir levels page, and see how that transparency ranks on the Reservoir Transparency Index.
FAQ
What is the current US reservoir level?
Across the major reservoirs we track in 37 states, storage is around 65% of combined capacity as of mid-June 2026, as a capacity-weighted average. It changes constantly; the live figure and the state map are on the United States page.
Which US state has the least water in its reservoirs?
By capacity-weighted fill, Nevada and New Mexico are lowest (both around 30%), followed by Utah (33%) — the Colorado River Basin and the Rio Grande.
Which US reservoir is the most depleted?
Among large reservoirs, Elephant Butte on the Rio Grande is lowest at roughly 7% of capacity. The two biggest reservoirs in the country, Lake Powell (23%) and Lake Mead (26%), are both about a quarter full.
Why is Lake Mead so low?
The Colorado River has been over-allocated for decades and has run through a prolonged low-flow period since 2000, so demand has consistently outpaced inflow. The result is a long structural decline at Lake Mead and Lake Powell rather than a single bad year.
Does a low reservoir percentage always mean drought?
No. Many US reservoirs run by the Army Corps of Engineers are flood-control projects that keep a large pool empty by design, so a low summer level can be normal operation. Always check the multi-year trend on the reservoir's page rather than reading one number.
Where does the data come from?
From official US agencies — the USGS, the Bureau of Reclamation, the Army Corps of Engineers and California's CDEC. reservoirs.earth mirrors those readings, adds history, and rolls them up on the United States page.
US reservoir data is unusually open, frequent and machine-readable. See how that transparency compares on the Reservoir Transparency Index.