As of mid-June 2026, Australia's monitored reservoirs are holding about 59% of their combined capacity — close to a normal level for early winter, but hiding a sharp split. The coast and the tropical north are full — Sydney's Warragamba is around 97% and the Kimberley's Lake Argyle is brimming after the wet season — while the inland southeast is running dry. The Murray–Darling storages in New South Wales are well below their usual June levels: Lake Menindee sits near 9%, and Hume and Burrendong are around 30%. The live national figure and the state map are on the Australia reservoir levels page. This is the June edition of a monthly check-in — for the south, the question is whether the winter rains arrive.
Key takeaways
- Australia is about 59% full nationally (mid-June 2026) — a few points below the typical level for this point in the year, with 31 reservoirs in the critical band (below 20%). The live figure is on the Australia page.
- The split is the story: full coast, dry inland. Sydney's Warragamba (around 97%) and the tropical north are high; the inland Murray–Darling is low.
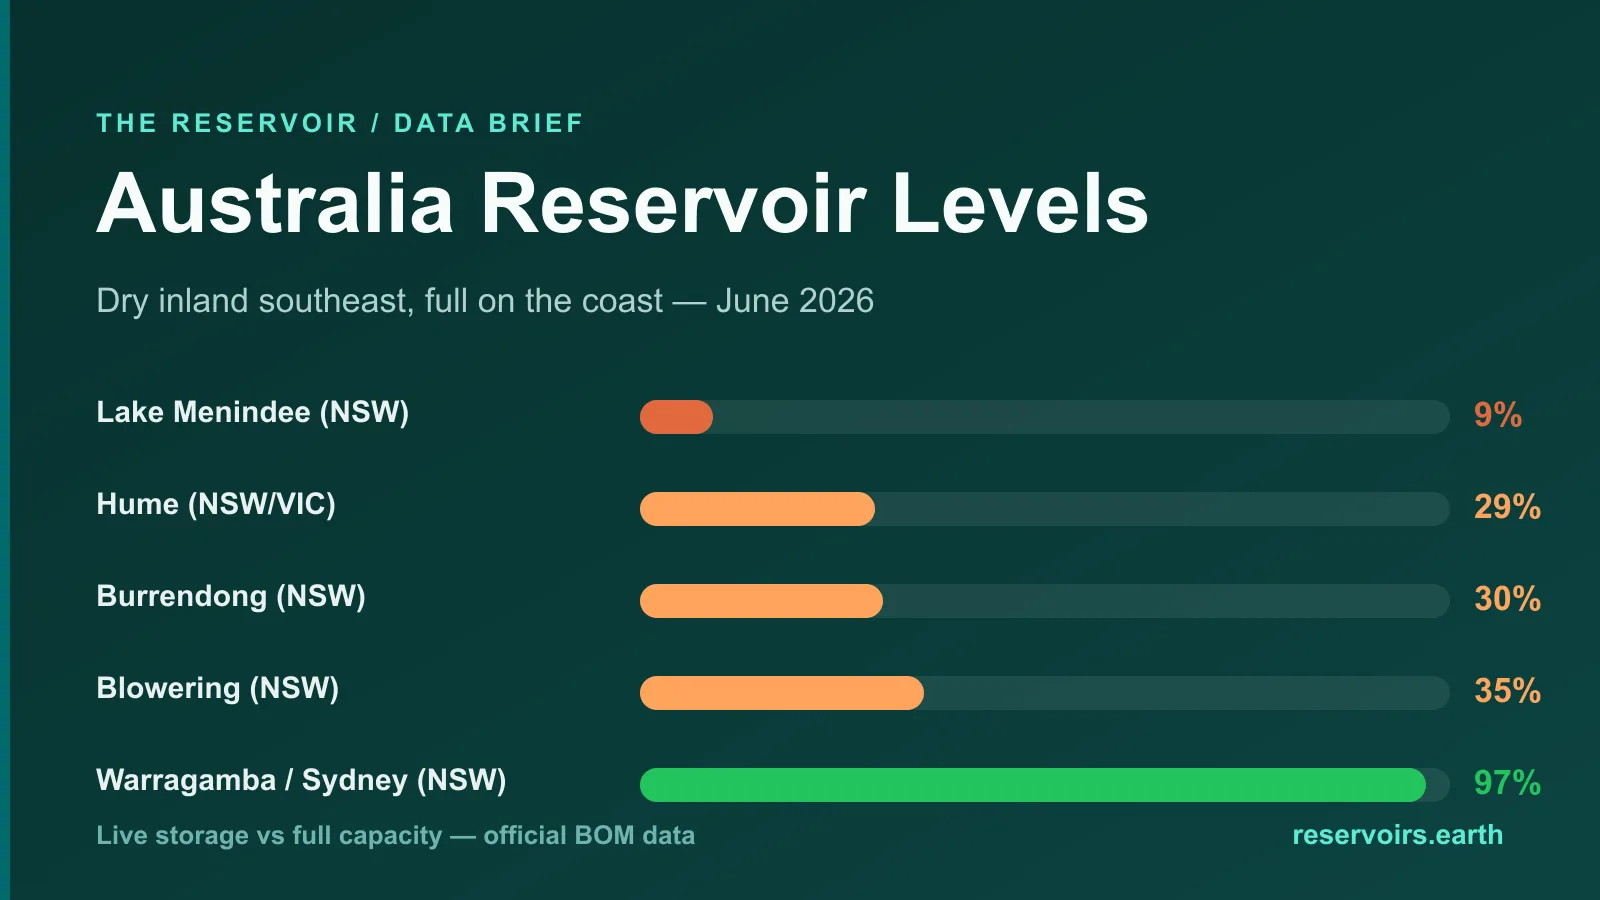
- Inland New South Wales is the dry spot. Lake Menindee (around 9%, against a June norm near 45%), Hume (around 29% vs a norm near 51%) and Burrendong (around 30% vs 58%) are all well below average for June.
- Tasmania reads low (about 34%) but that is hydro operation, not drought. Hydro Tasmania's storages hold the largest single share of national capacity and are drawn down to generate power — so they pull the national average down without signalling a shortage.
- The far north and the west coast are full: Lake Argyle on the Ord River is above 100% after its wet season, and South Australia (about 88%) and Queensland (about 79%) are in good shape.
Where Australia's reservoir data comes from
Australia's national source is the Bureau of Meteorology (BOM), which collates storage data from the states and water utilities and publishes it through its Water Storage / Water Data Online service. reservoirs.earth mirrors those readings and adds multi-year history. The latest reading in this snapshot is 17 June 2026, covering 281 reservoirs across the states and territories. Australia scores well for openness on the Reservoir Transparency Index because that national picture is public and machine-readable; each reservoir keeps its own page with the latest reading and history on the Australia page.
The national picture
The reservoirs we track hold a combined capacity of roughly 87 km³. As of 17 June 2026 they were storing about 51 km³ — close to 59% of capacity, as a capacity-weighted average. That number is dominated by two things, and reading it well means separating them.
First, Tasmania holds the most capacity of any state — about 26 km³ across some 40 storages — and almost all of it is hydropower storage operated by Hydro Tasmania. Those reservoirs are drawn down and refilled to generate electricity, so Lake Gordon at 50% or Great Lake at 27% is an operating decision, not a drought reading. Because Tasmania is so large in the denominator, it pulls the national figure down — much as the big Colorado River reservoirs do in the United States.
Second, outside Tasmania the country divides cleanly by climate. The winter-rainfall south — the Murray–Darling Basin and the southern capitals — is near its seasonal low and waiting on the cool-season rains. The summer-rainfall tropical north — the Kimberley, northern Queensland — is full, having just come through its wet season.
A tale of two Australias
Ranked by capacity-weighted fill, the state figures show the divide (mid-June 2026):
- Western Australia — about 100%. A figure dominated by the tropical north's Lake Argyle on the Ord River, which fills in the northern wet season. (Perth's south-west supply dams remain low year-round, which is why the city leans heavily on desalination — a separate story from the Ord.)
- South Australia — about 88% and Queensland — about 79%. Both in comfortable shape entering winter.
- New South Wales — about 57% and Victoria — about 55%. The headline figures look mid-range, but they average a full Sydney against a drawn-down inland.
- Tasmania — about 34%. Lowest of the states, but hydro storage (see above), not a supply crisis.
The contrast inside New South Wales is the sharpest in the country: Warragamba, Sydney's supply, is around 97%, while a few hundred kilometres inland the irrigation storages of the Murray–Darling are a third full or less.
The reservoirs running lowest (and why it matters where)
These inland southeastern storages are the ones well below their normal June level — the genuine dry signal, as opposed to seasonal or hydro lows. Each links to its live page:
- Lake Menindee — far-west NSW. Around 9%, against a June norm near 45%. The Menindee Lakes are shallow and swing hard with the Darling's flows.
- Hume — the Murray, on the NSW–Victoria border. Around 29% (June norm near 51%) — a backbone of Murray–Darling irrigation supply.
- Burrendong — Macquarie River, NSW. Around 30% (norm near 58%).
- Blowering (around 35%) and Burrinjuck (around 40%) — the Tumut and Murrumbidgee, both well down on their June averages.
For contrast, Victoria's big alpine storages Dartmouth (around 66%) and Lake Eildon (around 42%) are holding up better, and the Queensland systems behind Wivenhoe are comfortable. The risk is concentrated in the inland Murray–Darling, where a dry winter would carry straight into next summer's irrigation allocations.
What "% full" means here
A reservoir's level is reported as a percentage of its full storage capacity. Two cautions specific to Australia:
- Hydropower storages are operated, not just filled. Tasmania's reservoirs (and the Snowy scheme's Lake Eucumbene) are drawn down to generate power and refilled later, so a low percentage there is usually operation, not drought. Read them against their own history, not against a water-supply dam.
- The season runs opposite to the northern hemisphere. Southern Australia's reservoirs are near their low in autumn–early winter (around now) and refill through winter and spring, while the tropical north fills over the summer wet. Compare each storage to the same month in past years on its chart.
Why Australia's reservoir levels matter
Australia is the driest inhabited continent, and its storages do very different jobs in different places. The Murray–Darling Basin reservoirs underwrite the country's biggest irrigated-agriculture region, and their winter level sets the following season's water allocations — which is why a dry inland June is an economic signal, not just a weather one. The coastal capitals depend on a handful of large dams (Sydney on Warragamba, Brisbane on Wivenhoe), while Tasmania's storages are effectively the state's battery. Tracking them month by month — and separating seasonal and operational lows from genuine shortfalls — is the clearest read on where water stress is actually building.
FAQ
What is the current reservoir level in Australia? Across the 281 reservoirs we track, storage was about 59% of capacity as of 17 June 2026 — close to normal for early winter, but with a full coast and a dry inland southeast. The live figure and state map are on the Australia page.
Which Australian state has the least water in its reservoirs? Tasmania reads lowest (about 34%), but that is hydropower storage operated for generation, not a shortage. Among water-supply systems, the inland Murray–Darling storages in New South Wales are the genuinely dry ones.
Which Australian reservoir is the most depleted relative to normal? Lake Menindee in far-west NSW (around 9%, against a June norm near 45%), followed by Hume and Burrendong, both around 30% and well below their June averages.
Why is Sydney's dam full while the inland is dry? Sydney's Warragamba catches east-coast rainfall and is around 97%, while the Murray–Darling storages a few hundred kilometres inland depend on different, and this year weaker, cool-season rain. It is one country with very different rainfall regimes.
Where does the data come from? The Bureau of Meteorology (BOM), which collates state and utility storage data through its Water Data Online service. reservoirs.earth mirrors it and adds multi-year history on the Australia page.
When do southern reservoirs refill? Through winter and spring — roughly June to November. Watch the trajectory in next month's edition: in the south, the speed of the winter refill is the real signal.
This is the June 2026 edition. We track the major water economies month by month — see the India and United States editions, and follow Australia on the Australia reservoir levels page and the Reservoir Transparency Index.