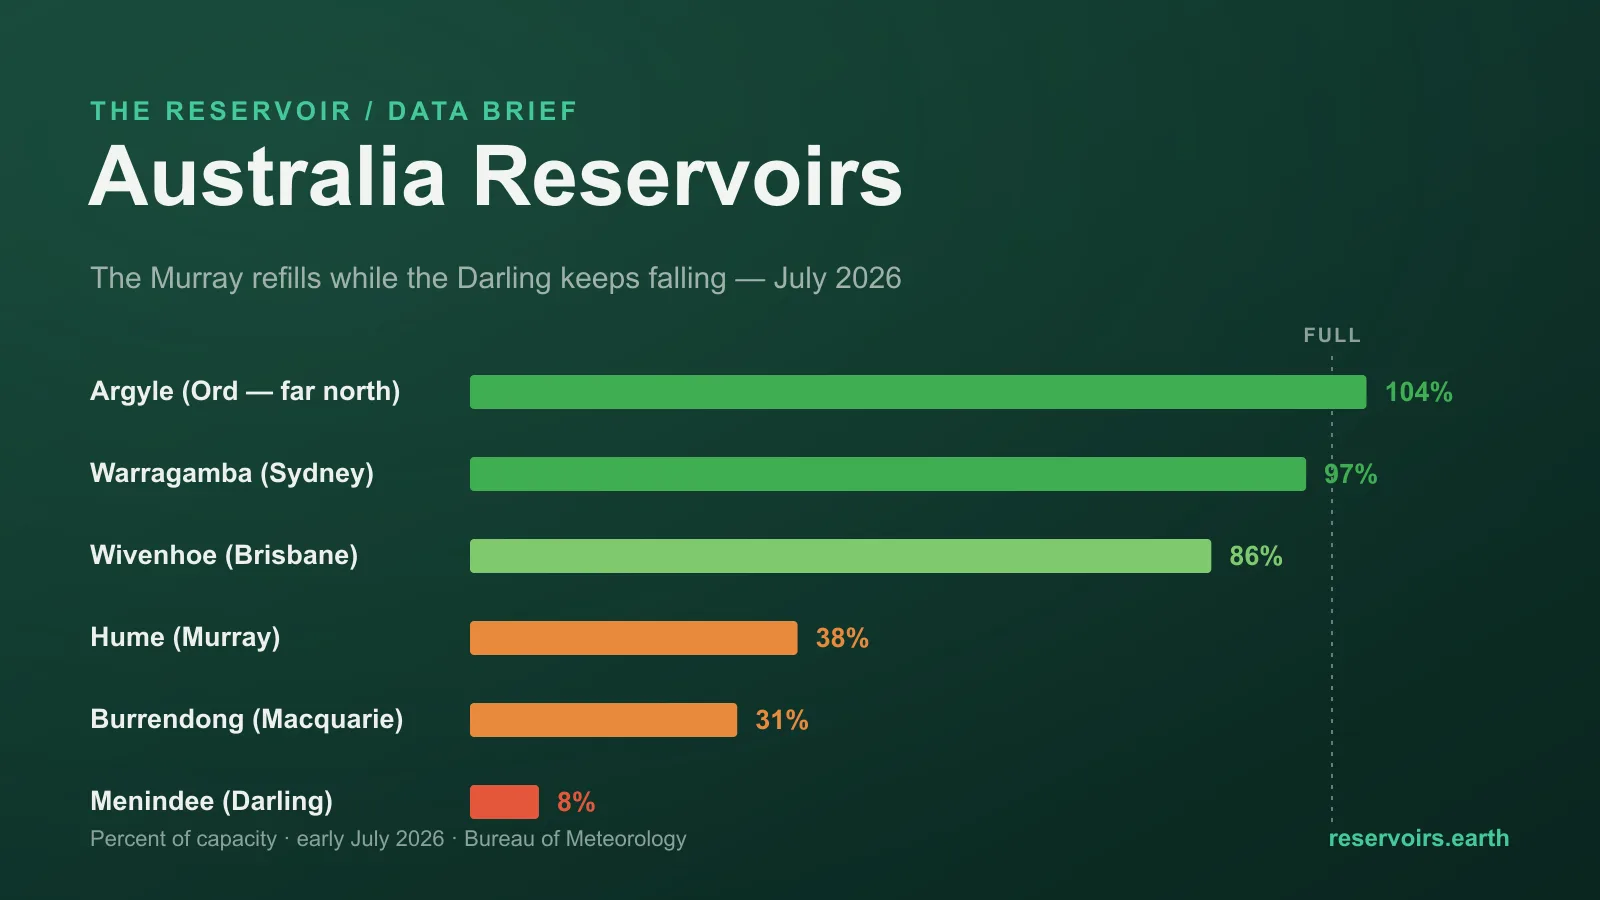
As of early July 2026, Australia's monitored reservoirs hold about 59% of their combined capacity — essentially where they stood in mid-June. But the flat national number hides the year's big seasonal handover, and this month it split the inland southeast in two. The winter refill has started on the Murray side: Hume climbed from about 29% to around 38% in a little over two weeks, and Blowering jumped almost ten points to about 45%. The Darling side missed out: Lake Menindee kept falling, to about 8% against a recent July average near 57%, and Burrendong barely moved at about 31%. Meanwhile the tropical north began its scheduled dry-season decline from full. The live number and the state-by-state map are on the Australia reservoir levels page. This is the July edition of a monthly check-in — June's open question was whether the winter rains would arrive, and the answer so far is: on half the map.
Key takeaways
- Australia is about 59% full nationally (early July 2026), essentially unchanged from mid-June. Underneath, the southern states gained water while the tropical north drained on schedule — the two movements roughly cancel out. The live figure is on the Australia page.
- The winter refill is real on the Murray. Hume rose from about 29% to about 38% in a little over a fortnight, Blowering from ~36% to ~45%, and the Murray border storages as a group climbed from roughly 32% to 40%.
- The Darling side is the problem. Lake Menindee fell to about 8% — its recent July average is near 57% — and Burrendong on the Macquarie has barely moved at about 31% against a July average near 70%.
- Tasmania still reads lowest (about 34%) and it is still hydro operation, not drought. Lake Gordon, the country's largest storage, sits at 50% — actually above its recent July average.
- The full half of the country stays full: Western Australia around 98% with Lake Argyle above nominal full supply at ~104%, South Australia just over 90%, and Queensland around 79% with four dams at or above 100%.
Where Australia's reservoir data comes from
Australia's national source is the Bureau of Meteorology (BOM), which collects storage readings from the state agencies and utilities — WaterNSW, Melbourne Water, Seqwater and their peers report under the federal water regulations — and publishes them through its Water Data Online service. reservoirs.earth mirrors that feed every weekday and adds multi-year history. The latest reading in this snapshot is 5 July 2026. Of the 281 reservoirs we track, 251 currently report: any storage without a reading in the last 45 days drops out of every average on the site rather than silently distorting it. That single national, machine-readable feed is why Australia scores an A on the Reservoir Transparency Index. Every figure below is dated, because levels change daily.
The national picture: a seesaw, not a plateau
The reservoirs we track hold a combined capacity of roughly 87 km³, and as of early July they store about 50 km³ — 59% of capacity as a capacity-weighted average, with 24 storages in the critical band below 20%. Compared on the same set of reservoirs, national storage rose by less than 1 km³ since mid-June — barely a point of capacity, and really two large opposite movements mostly cancelling out.
On one side, the winter-rainfall south is filling. Victoria moved from about 56% to almost 59%, New South Wales from about 55% to 57%, South Australia from 88% to just over 90% — and the Murray border storages, the group that includes Hume, jumped about eight points. On the other side, the summer-rainfall north is drawing down, exactly as the calendar says it should: Western Australia eased from about 99% to 98% as the Kimberley's dry season set in, and Queensland slipped fractionally to about 79%.
Tasmania, as every month, needs its own sentence: about 34% full, the lowest figure of any state, and still not a drought signal. Hydro Tasmania operates those storages as the state's battery, and the clearest tell is that Lake Gordon — the largest single reservoir in the country at roughly 12 km³ — sits at 50%, comfortably above its recent July average of about 36%. Drawn-down hydro lakes pull the national number down without anyone being short of water.
The refill scoreboard: Murray up, Darling flat
The clearest way to see July's split is to line the big inland southeastern storages up against mid-June and against their own recent July average (computed from our multi-year BOM history). Every one links to its live page:
| Storage |
River / role |
Mid-June |
Early July |
Recent July avg |
| Hume |
Murray — border irrigation backbone |
~29% |
~38% |
~66% |
| Blowering |
Tumut — carries Snowy scheme outflows |
~36% |
~45% |
~71% |
| Burrinjuck |
Murrumbidgee |
~41% |
~45% |
~71% |
| Lake Eildon |
Goulburn, Victoria |
~42% |
~46% |
~78% |
| Dartmouth |
Mitta Mitta, Victoria — deep alpine store |
~66% |
~68% |
~75% |
| Burrendong |
Macquarie — northern basin |
~30% |
~31% |
~69% |
| Lake Menindee |
Darling — far-west NSW |
~9% |
~8% |
~57% |
Two honest readings of that table. First, the refill is genuinely under way where it counts most by volume: Hume and Blowering are climbing at a pace that, sustained through winter, changes next season's irrigation outlook. Second, every row is still below its recent July average — most by 25 points or more — so the refill is a direction, not a recovery. A wet late June turned the Murray around; it has not come close to catching it up.
Menindee is falling through the refill
The standout number this month is the one moving the wrong way. Lake Menindee slipped from about 9% to about 8% while nearly everything south of it rose — and its recent July average is near 57%. The reason is geography, not bad luck. The Menindee Lakes are broad, shallow basins on the lower Darling that lose heavily to evaporation and refill only when rain falls far upstream, across the northern Murray–Darling Basin in Queensland and northern New South Wales. The frontal winter rains now topping up the alpine storages in the south mostly never reach that catchment; its wet season is summer-driven. Burrendong, on the Macquarie in the same northern basin, tells the same story sideways: barely moving at about 31% while its July average is near 70%.
That split matters economically. Northern-basin storages set water allocations for a large share of inland irrigation, and a winter that refills the Murray but leaves the Darling arm empty carries the imbalance straight into the 2026–27 summer.
The full half of the country
The June edition called Australia's situation "full coast, dry inland" — the full half held its ground in July. Lake Argyle on the Ord River reads about 104% — above its nominal full supply level, a legitimate reading after the northern wet season, and drifting down only slowly. South Australia is near 90% and still edging up. Queensland holds around 79%, with Wivenhoe — Brisbane's key storage — at about 86%, above its own recent July average, and four dams at or above the 100% line, led by Tinaroo Falls at ~101%. Sydney's Warragamba remains effectively full at about 97%.
What "% full" means here
Three cautions for reading Australian storage numbers, all regulars in this series:
- Hydropower storages are operated, not just filled. Tasmania's lakes and the Snowy scheme's storages are drawn down to generate power and refilled later. The Snowy's Tantangara Reservoir at about 12% is the extreme case — it is a diversion pond built to pass water on to Lake Eucumbene (itself at about 37%), so its level is plumbing, not drought.
- Above 100% is a real reading, not an error. Fill is reported against nominal full supply capacity, and storages like Lake Argyle can legitimately sit above it after a strong wet season.
- "Average" here means our multi-year BOM history, not a long-term climatology — a recent-years yardstick for the same month. Comparing each storage to the same month on its own chart remains the fairest read, and the seasons run opposite to the northern hemisphere: the south fills June–November, the north over the summer wet.
What to watch in August
The trajectory question from June is now three narrower ones. How fast does the Murray side keep climbing? Allocation decisions firm up in late winter, and Hume, Blowering and Burrinjuck are still 25–30 points below their recent July averages. Does Menindee turn at all? That needs rain in the northern basin, not more of the fronts feeding the south. The north's slow glide down is the calendar, not a warning — Argyle easing off 104% is what July is supposed to look like. The honest summary: the refill has started, but so far it is refilling the half of the inland that was already less dry.
This is the July 2026 edition, following Australia Reservoir Levels, June 2026. We track the major water economies month by month — see the India and Colorado July editions — and follow Australia between editions on the Australia reservoir levels page and the Reservoir Transparency Index.