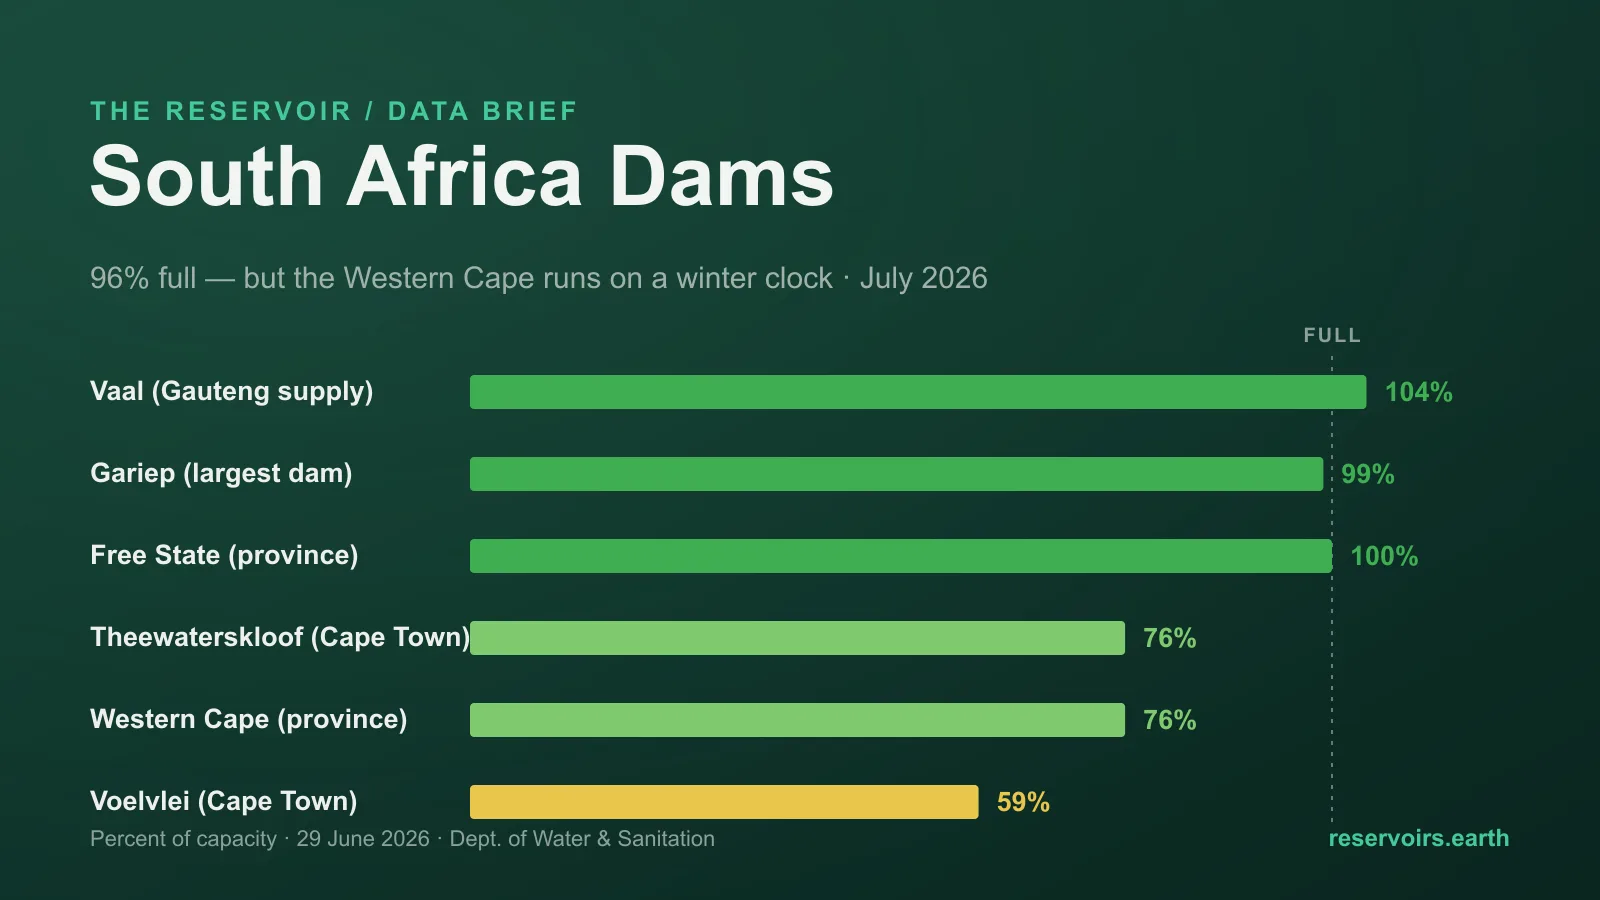
As of the latest weekly bulletin (29 June 2026), South Africa's monitored dams are holding about 96% of their combined capacity — near the top of their range after a strong summer rainfall season, and one of the fullest readings the country records. But that national figure hides a single region on a different calendar: the Western Cape, Cape Town's winter-rainfall catchment, is only about 76% full and still filling, while the rest of the country is brimming and beginning its slow dry-season decline. The live national figure and the provincial map are on the South Africa dam levels page. This is the July edition of a monthly check-in — and for once the story is not where water is short, but how differently the two halves of the country's rainfall clock are running.
Key takeaways
- South Africa is about 96% full nationally (29 June 2026) — an unusually high reading, with zero dams in the critical band below 20% and only one below 40%. The live figure is on the South Africa page.
- The summer-rainfall interior is brimming and just past its peak. Free State (
100%), Limpopo (100%), Mpumalanga (99%) and North West (103%) are all full and easing down by fractions of a percent week over week.
- The Western Cape is the exception — and it is rising, not falling. At ~76% it gained more than a point in the week to 29 June, because its rain arrives in winter, exactly now. Cape Town's big dams are filling toward a spring peak.
- The giants are effectively full. The Vaal (
104%) and the Gariep, the country's largest dam (99%), anchor the national number and underwrite the Integrated Vaal River System that supplies Gauteng.
- The lowest dams are almost all in the Western Cape, and they are low because they are mid-refill: Voelvlei (
59%), Brandvlei (53%) and Kwaggaskloof (~52%).
Where South Africa's dam data comes from
South Africa's national source is the Department of Water and Sanitation (DWS), which publishes a Weekly State of the Reservoirs bulletin covering about 218 dams that hold more than 90% of national storage. reservoirs.earth mirrors that bulletin and keeps each dam's multi-year history. The most recent reading in this snapshot is 29 June 2026. Every figure below is dated, because levels change from week to week — and the country's open, machine-readable weekly bulletin is why South Africa scores well on the Reservoir Transparency Index. For the mechanics of how the national figure is built from nine provinces, see our South Africa dam levels explainer.
The national picture: two rainfall clocks
The dams on our South Africa page hold a combined capacity of roughly 29 km³, and as of 29 June 2026 they stored about 28 km³ — around 96% of capacity, as a capacity-weighted average. (DWS's own national bulletin quotes a slightly higher total because it also counts shared dams in Lesotho and Eswatini; the figures here are the ones behind our South Africa page.) That is a high number by any standard, and reading it well means separating the two rainfall regimes that produce it.
Most of South Africa is a summer-rainfall country: the interior and the eastern provinces get their rain between October and March, so by late June their dams are near-full and have just started the long, slow drawdown through the dry winter. That is why Free State, Limpopo, Mpumalanga, Gauteng and North West all sit at or just above 100%, each slipping by only a few tenths of a percent week over week.
The Western Cape — the southwestern corner around Cape Town — is the country's main winter-rainfall region. Its dams are refilled by cold-front rain between roughly May and September, so late June is when they are climbing, not declining. At about 76% the province is the lowest in the country, but it gained more than a point in the week to 29 June. That is a refill in progress, not a shortage.
A tale of two seasons
Ranked by capacity-weighted fill, the provincial figures show the split cleanly (29 June 2026):
Every summer-rainfall province is drifting down by a fraction as the dry season sets in; the Western Cape is the only one moving up. It is the same pattern that makes Australia's map split north from south — except here the divide is between a country that has already banked its water and one corner still collecting it.
Cape Town is filling on schedule
The Western Cape's position matters more than its size, because it is Cape Town's supply — the city whose dams fell toward a "Day Zero" in 2018. This winter the system is filling on schedule. Theewaterskloof, the largest dam in the Cape Town supply system, was about 76% and rising; the Berg River dam jumped from 78% to ~85% in a single week; and Wemmershoek is effectively full. The lower-lying Voelvlei (59%) and the Breede-system storages Brandvlei (53%) and Kwaggaskloof (52%) are lower, but all gained ground on the week. With two to three months of the wet season still to run, the Cape's dams have time to climb further before their spring peak.
What "% full" means here
Two cautions for reading South African dam numbers, both of which this month makes concrete:
- A high national number is a summer legacy, not a live surplus. At 96% the country is storing the water it banked over the wet summer; from here most of it declines until the next summer rains. The number to watch is not the peak but the rate of drawdown through winter and spring.
- A low regional number can be a refill, not a drought. The Western Cape at 76% is climbing toward its seasonal high, not falling toward a shortage. Read each dam against the same week in past years on its own chart, and against its rainfall regime, before calling a level high or low. A handful of balancing dams — like Steenbras-Lower (~47%), part of Cape Town's pumped-storage scheme — swing with operations rather than rainfall.
Why it matters
South Africa is a water-scarce country that stores an entire year of supply behind its dams, so the winter peak sets the buffer that has to last until the next rains. For most of the country that buffer is close to full this year. The open question sits in the two regions below the national line: whether the Western Cape's winter rains keep filling Cape Town's dams through spring, and whether the drier Eastern Cape storages hold up through the dry months. We will track both, week by week.
This is the July 2026 edition. We track the major water economies month by month — see the Australia and India July editions — and follow South Africa between editions on the South Africa dam levels page, the provincial breakdown explainer, and the Reservoir Transparency Index.