As of early July 2026, India's monitored reservoirs are holding about 24% of their capacity — roughly 53 km³ of water — essentially flat on June's reading and still sitting at the annual pre-monsoon floor. That is the seasonal norm, not an alarm: Indian reservoirs bottom out in June and refill from the southwest monsoon between June and September. The difference this month is where the low is concentrated. The big northern and central reservoirs that hold most of the country's capacity kept emptying through late June — Indira Sagar, the largest, is down to about 15%, and Hirakud on the Mahanadi is at 15% — while the live southern state portals show the Deccan reservoirs starting from the same floor. About 120 of the roughly 290 reservoirs we have a current reading for are below 20% full. The live national figure and the state map are on the India reservoir levels page; this is the July edition of a monthly check-in, and July is the month the monsoon is supposed to flip these reservoirs from drawdown to refill.
Key takeaways
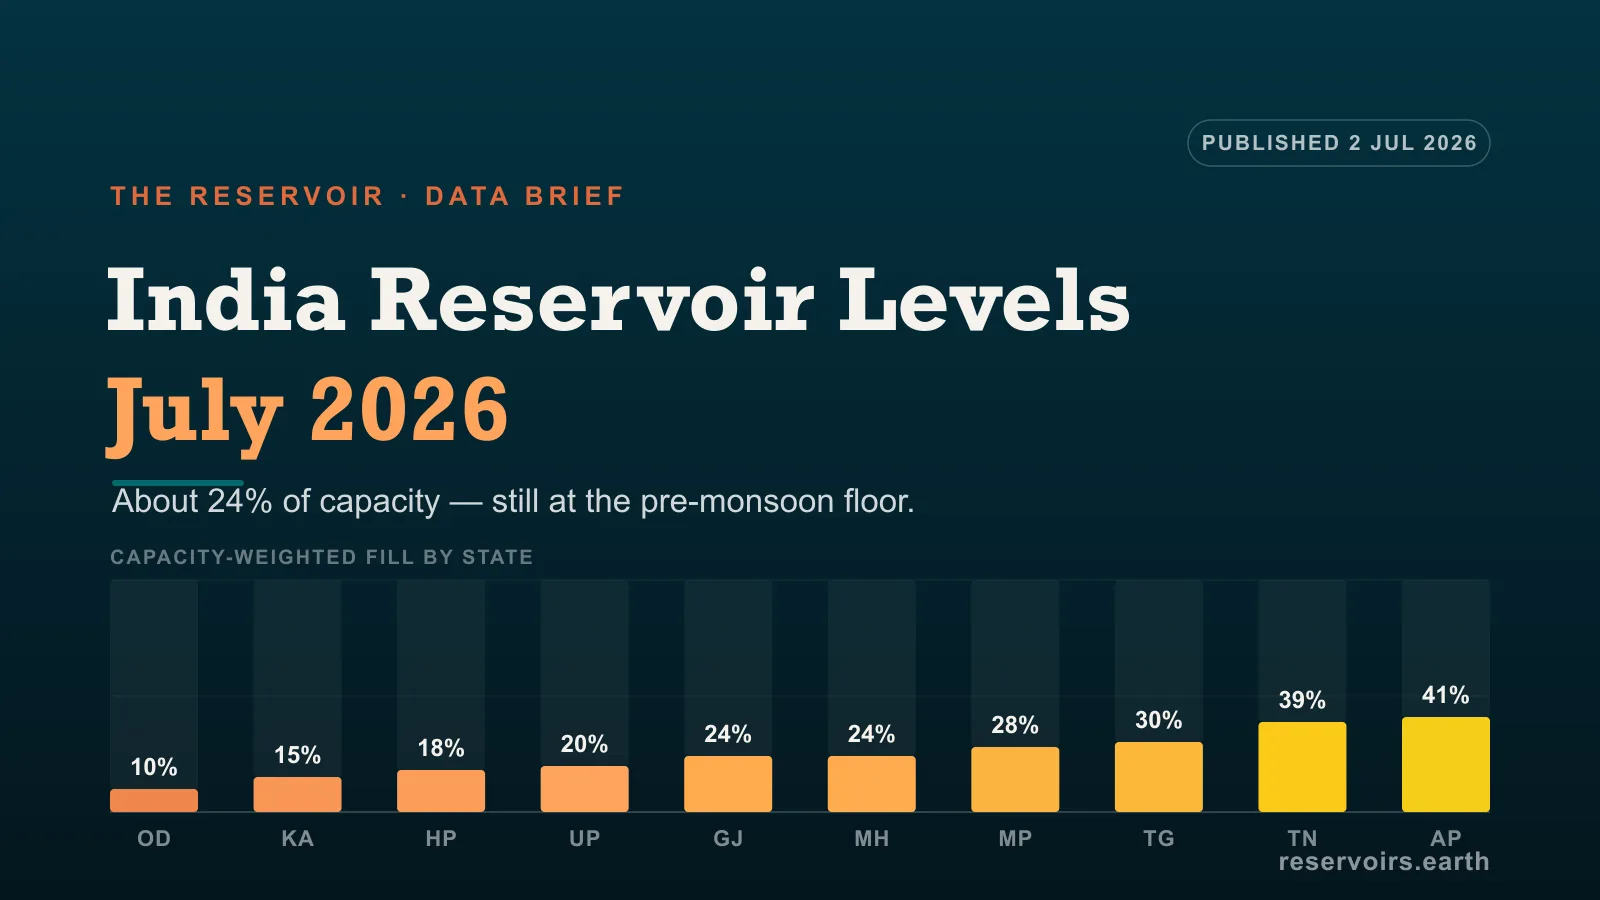
- India's reservoirs are about 24% of capacity (~53 km³) in early July 2026 — the seasonal floor, essentially unchanged from June. The southwest monsoon normally refills them from June to September, so this is the annual low by design. The live figure is on the India page.
- The biggest reservoirs are the lowest, and they kept falling through late June. Indira Sagar (India's largest,
15%), Hirakud (15%), Rihand (21%) and Bhakra / Gobind Sagar (22%) each drew down by 10–15 points over the six weeks to the 25 June bulletin. - The driest states are Odisha (
10%), Karnataka (15%), Himachal Pradesh (18%) and Uttar Pradesh (20%). No large state is anywhere near full ahead of the rains. - About 120 of the ~290 reservoirs with a live reading are below 20% full — the critical band — which is typical for this point in the monsoon calendar.
- Data vintage matters this month. The national CWC bulletin's latest reading is 25 June 2026; the live state portals for Andhra Pradesh, Telangana, Tamil Nadu and Kerala are current to 1–2 July. This snapshot blends the two, so the southern reservoirs are a week fresher than the national ones.
Where India's reservoir data comes from
India's authoritative source is the Central Water Commission (CWC), which publishes a weekly Reservoir Storage Bulletin tracking the country's major reservoirs against their full reservoir level (FRL) and the last decade's average. reservoirs.earth mirrors that bulletin and overlays several live state water portals — Andhra Pradesh, Telangana, Kerala, Tamil Nadu and Bihar — so the most-watched reservoirs refresh more often than the weekly national cycle. In this snapshot the latest CWC reading is 25 June 2026 and the freshest state-portal readings are 1–2 July 2026. India scores reasonably for openness on the Reservoir Transparency Index precisely because the CWC bulletin is public and regular; each reservoir keeps its own page with the latest reading and multi-year history, reachable from the India page.
The national picture
The reservoirs we track hold a combined capacity of roughly 221 km³. In early July they were storing about 53 km³ — close to 24% of capacity, as a capacity-weighted average across the reservoirs with a live reading. In absolute terms that is barely changed from the ~54 km³ of late June: storage has flattened out at the bottom of the seasonal curve. The percentage reads a shade lower than June's headline mainly because we now track a wider set of reservoirs (the live Andhra Pradesh portal alone adds more than a hundred), which enlarges the denominator; the water itself is essentially flat.
The important detail is that the drawdown had not yet reversed as of the last national bulletin. Through the six weeks to 25 June, the large reservoirs that carry the national number were still emptying:
| Reservoir | River / state | Early May | 25 June |
|---|---|---|---|
| Indira Sagar | Narmada, Madhya Pradesh | 30% | 15% |
| Rihand | Son, Uttar Pradesh | 37% | 21% |
| Bhakra / Gobind Sagar | Sutlej, Himachal Pradesh | 33% | 22% |
| Hirakud | Mahanadi, Odisha | 27% | 15% |
| Pong | Beas, Himachal Pradesh | 37% | 27% |
That is the signature of a normal pre-monsoon summer: reservoirs release water for irrigation and cities while the rains have not yet arrived over their catchments. The question July answers is how quickly that curve turns upward.
Why July is the pivot month
India's water year runs on one event: the southwest monsoon. It normally reaches Kerala around 1 June, advances north and west to cover the whole country by around mid-July, and withdraws in September. Roughly three-quarters of India's annual rainfall — and almost all of its reservoir refill — falls between June and September. But reservoir storage lags the rain: the first weeks of monsoon go into dry soils, rivers and hydropower demand before the surplus starts banking behind dams. That is why a reservoir can be at its lowest of the year in late June even as the monsoon is already overhead.
So July is the hinge. In a normal year, the big central and southern reservoirs stop falling in early July and begin a steep climb through August. A late or weak monsoon shows up first as a floor that holds too long — reservoirs stuck in single digits into mid-July with no upturn. The number to watch across the next two editions is not the level itself but its trajectory: how fast storage climbs off this floor, and whether any region is left behind. The multi-year chart on each reservoir's page (and on the national page) is built for exactly that comparison.
The reservoirs running lowest
The large reservoirs (capacity above 1 km³) holding the least relative to capacity, from the latest reading on each one's page:
| Reservoir | River / state | Fill |
|---|---|---|
| Rengali | Brahmani, Odisha | ~1% |
| Tehri | Bhagirathi, Uttarakhand | ~2% |
| Malaprabha | Krishna, Karnataka | ~5% |
| Ghataprabha (Hidkal) | Krishna, Karnataka | ~6% |
| Krishnaraja Sagar (KRS) | Cauvery, Karnataka | ~7% |
| Tungabhadra | Tungabhadra, Karnataka | ~9% |
| Linganamakki | Sharavathi, Karnataka | ~10% |
| Hirakud | Mahanadi, Odisha | ~15% |
| Indira Sagar | Narmada, Madhya Pradesh | ~15% |
The cluster is telling: most of the emptiest large reservoirs are on the Krishna and Cauvery systems in Karnataka, the Deccan interior that waits longest for the monsoon's westerly branch to clear the Western Ghats. Krishnaraja Sagar — the reservoir at the centre of the perennial Karnataka–Tamil Nadu Cauvery dispute, and a key supply for Bengaluru and Mysuru — sits near its floor at about 7%. These are seasonal lows, not permanent ones; most refill sharply once the rains reach the Ghats.
The driest states
Ranked by capacity-weighted fill, from the live state pages (states with several sizeable reservoirs):
- Odisha — ~10%. The lowest large state, dragged down by Rengali (
1%) and Hirakud (15%) on the Mahanadi and Brahmani. - Karnataka — ~15%. Home to the most depleted big reservoirs in the country — Malaprabha, Krishnaraja Sagar, Tungabhadra and Linganamakki — all near their Cauvery–Krishna floor.
- Himachal Pradesh — ~18%. The big northern storages Bhakra / Gobind Sagar (
22%) and Pong (27%) are drawn down ahead of the snowmelt-and-monsoon refill. - Uttar Pradesh — ~20%, anchored by Rihand (~21%) on the Son.
No large state is close to full this far ahead of the rains. Tamil Nadu reads higher (~39%) partly because its cycle is out of step with the rest of the country — it depends on the northeast monsoon (October–December) — and its marquee reservoir, Mettur on the Cauvery, is about 43%.
Where the water is
Not everything is low. The relatively comfortable large reservoirs, again from the latest reading on each page:
- Pulichintala — Krishna, Andhra Pradesh. ~72%.
- Bisalpur — Banas, Rajasthan. ~66% — the main supply for Jaipur and Ajmer.
- Gandhi Sagar — Chambal, Madhya Pradesh. ~61%.
- Nagarjuna Sagar — Krishna, Telangana. ~44%.
- Sardar Sarovar — Narmada, Gujarat. ~43%.
These are the reservoirs entering the monsoon with a cushion — mostly on the Chambal, the lower Krishna and the Narmada, systems that either held more carryover or already caught early inflow.
What "% full" means here
A reservoir's level is reported as a percentage of its full reservoir level (FRL) — the volume it holds when filled to its design level. So 7% full means it is holding 7% of that storage. Three cautions specific to this July snapshot:
- The July number is the seasonal floor, not a steady state. Compare it to the same month in previous years on each reservoir's chart, not to a winter or post-monsoon figure.
- The readings are not all from the same day. The national CWC bulletin is current to 25 June; the live state portals (Andhra Pradesh, Telangana, Tamil Nadu, Kerala) are current to 1–2 July. We date every reading and never restamp a figure to look newer than it is.
- Coverage is partial by design. The CWC bulletin and the state portals track the major reservoirs that carry the national picture, not every minor tank and check dam. The national figure is a capacity-weighted average of the reservoirs with a live reading.
Why India's reservoir levels matter
India is the world's most populous country and one of its largest irrigated-agriculture economies, and its reservoirs do three jobs at once: irrigate the crop, supply cities and industry, and generate hydropower. The pre-monsoon low is when those demands compete hardest — which is why the Cauvery and Krishna reservoirs turn political almost every dry season, and why a delayed monsoon is a national-economy story, not just a weather one. The clearest early read on how the year will go is not the July level itself but how fast these reservoirs climb off it — which is what the August and September editions will track, reservoir by reservoir.
FAQ
What is the current reservoir level in India? Across the major reservoirs we track, storage was about 24% of capacity (roughly 53 km³) in early July 2026 — near the annual pre-monsoon low. It changes weekly; the live figure and the state map are on the India page.
Why are Indian reservoirs so low in July? Because early July is still near the end of the dry-season drawdown. India gets roughly three-quarters of its rain — and almost all its reservoir refill — from the southwest monsoon between June and September, and reservoir storage lags the rain by several weeks, so it bottoms out in late June and early July before climbing.
Which Indian state has the least water in its reservoirs?
By capacity-weighted fill, Odisha (10%) and Karnataka (15%) are lowest, followed by Himachal Pradesh and Uttar Pradesh. No large state is full ahead of the monsoon.
Which Indian reservoir is the most depleted?
Among large reservoirs, Rengali in Odisha (1%) and Tehri in Uttarakhand (2%) are at the bottom, with a cluster of Karnataka reservoirs — Malaprabha, Krishnaraja Sagar and Tungabhadra — in single digits on the Krishna and Cauvery.
Where does the data come from? The Central Water Commission (CWC) weekly Reservoir Storage Bulletin (latest reading 25 June 2026), supplemented by live state portals — Andhra Pradesh, Telangana, Kerala, Tamil Nadu and Bihar (current to 1–2 July). reservoirs.earth mirrors these and adds multi-year history on the India page.
When will the reservoirs refill? Through the monsoon — typically June to September, with the steepest climb in July and August. Watch the trajectory in next month's edition: the speed of the rise off this floor is the real signal.
This is the July 2026 edition, following India Reservoir Levels, June 2026. We track the major water economies month by month — see the Texas and Arizona July editions — and you can follow the monsoon refill on the India reservoir levels page and the Reservoir Transparency Index.