Texas is holding roughly two-thirds of its reservoir capacity as summer sets in — a little below the normal level for early July — but that single number hides two very different states. As of late June 2026, the big reservoirs of North and East Texas are essentially full: Lake Texoma is around 102%, Lake Conroe about 100%, Lake Tawakoni near 99% and Lake Livingston about 92%. Meanwhile South and West Texas are in a grinding, multi-year drought: Choke Canyon, a main supply for the Corpus Christi area, is down to about 8% and has fallen every single year for five years, and E.V. Spence near Robert Lee is around 11%. A statewide reservoir average is close to meaningless in a state this large and this lopsided — the story is the split. Live figures are on the Texas reservoir page; the national picture is on the United States page.
Key takeaways
- Texas is about two-thirds full statewide entering July 2026 — roughly 90% of the normal early-July level. That is close to average overall, but the state average hides a sharp geographic split. Live numbers are on the Texas page.
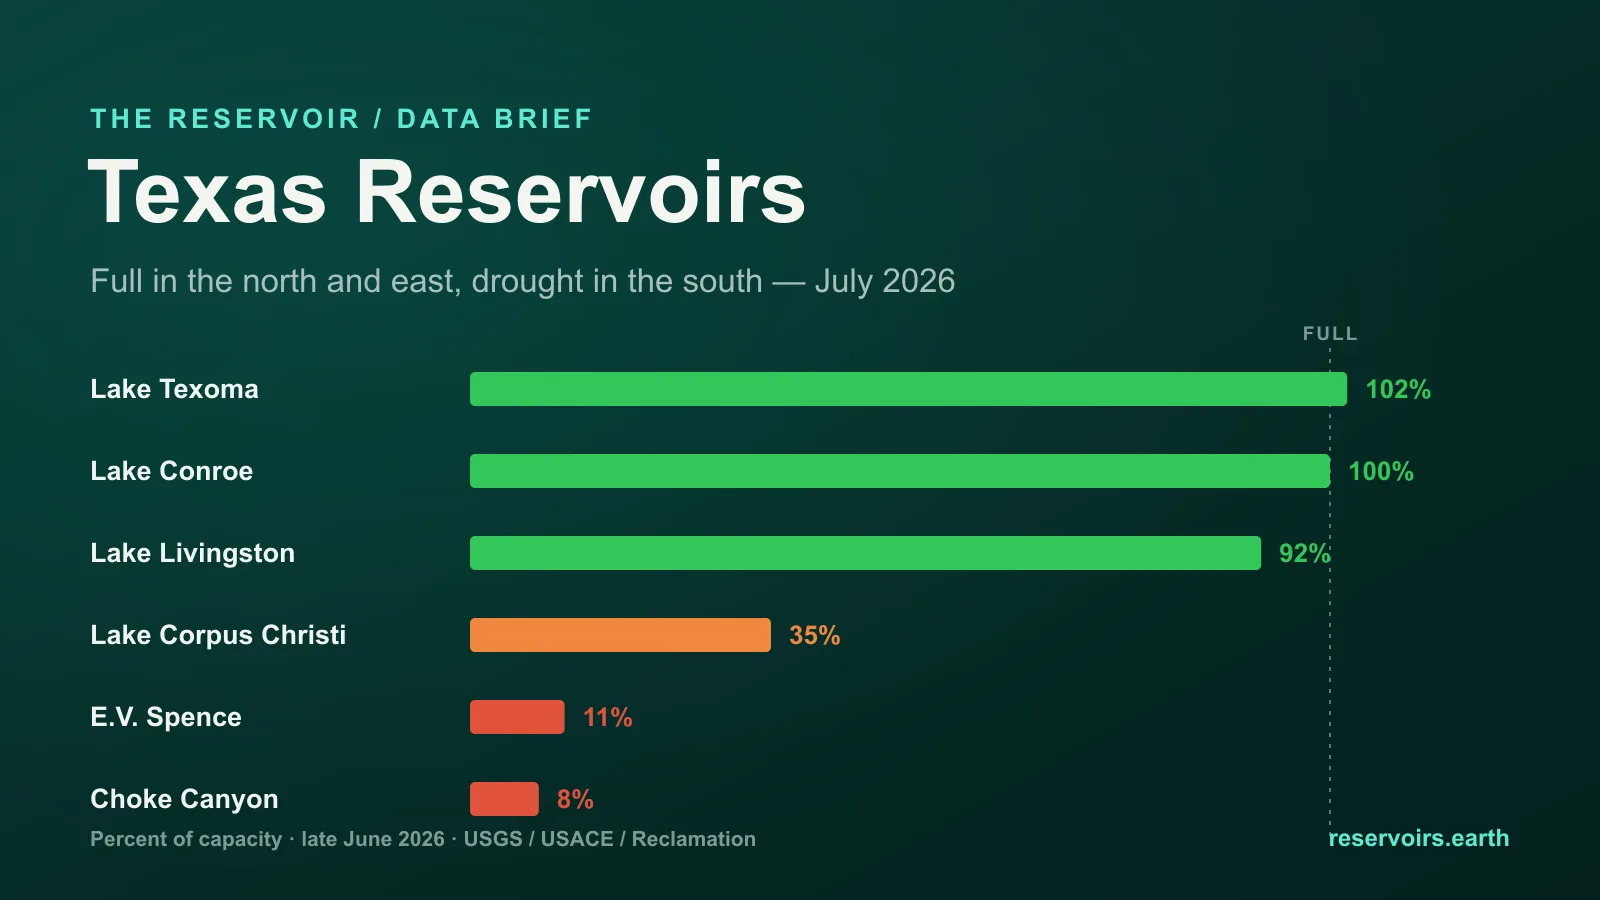
- North and East Texas are essentially full. Lake Texoma (
102%), Lake Conroe (100%), Lake Tawakoni (99%) and Richland-Chambers (96%) are at or near capacity after a wet spring. - South and West Texas are in serious drought. Choke Canyon is about 8%, Twin Buttes near San Angelo about 10%, and Lake Corpus Christi about 35%. Choke Canyon has dropped in each of the last five Julys.
- The Corpus Christi water supply is the sharpest crisis. Its two main reservoirs — Choke Canyon and Lake Corpus Christi — together sit far below normal, and full lakes 300 miles to the north cannot help: Texas has no statewide grid to move that water.
- Watch the "0%" reservoirs carefully. Barker and Addicks near Houston read 0% — but that is normal. They are dry flood-control basins by design, not drought casualties.
Where the data comes from
There is no single, live national bulletin for US reservoirs, and Texas is a good example of why. The state's own dashboard, Water Data for Texas (run by the Texas Water Development Board), publishes a statewide storage percentage; the individual gauges come from a mix of federal agencies — the US Geological Survey (USGS) for most river-and-reservoir sites, the US Army Corps of Engineers (USACE) for its flood-control lakes, and the US Bureau of Reclamation for a few federal projects. reservoirs.earth mirrors those federal gauges, adds multi-year history, and rolls them up by state. Every figure below is dated, because reservoir levels change daily; the live numbers and each reservoir's chart are on the Texas page and on each reservoir's own page.
The current picture (as of late June 2026)
Across the reservoirs we track in Texas, storage sits at about two-thirds of capacity — a touch below the typical level for the start of July. The state divides cleanly along a wet east/north versus dry south/west line.
The full end — North and East Texas, after a wet spring:
| Reservoir | River / area | Fill |
|---|---|---|
| Lake Texoma | Red River (N) | 102% |
| Lake Conroe | San Jacinto (E) | 100% |
| Lake Tawakoni | Sabine (NE) | 99% |
| Richland-Chambers | Trinity (NE) | 96% |
| Lake Livingston | Trinity (E) | 92% |
| Lake Fork | Sabine (NE) | 92% |
The dry end — South and West Texas:
| Reservoir | River / area | Fill |
|---|---|---|
| Lake Corpus Christi | Nueces (S) | 35% |
| Lake Meredith | Canadian (Panhandle) | 27% |
| E.V. Spence | Colorado (W) | 11% |
| Twin Buttes | Concho (W) | 10% |
| Medina Lake | Medina (Hill Country) | 9% |
| Choke Canyon | Frio (S) | 8% |
One reservoir worth a caveat: O.H. Ivie in West Texas is only about 48% full, but that is actually above its recent-years norm — it was drawn far lower in 2024. A low percentage is not always a falling one.
The five-year slide in South Texas
The clearest way to see the drought is not a single snapshot but the trend. Here are three South and West Texas reservoirs in early July of each of the last five years, from our record:
| Reservoir | Jul 2022 | Jul 2023 | Jul 2024 | Jul 2025 | Jul 2026 |
|---|---|---|---|---|---|
| Choke Canyon | 37% | 29% | 20% | 12% | 8% |
| Lake Corpus Christi | 55% | 71% | 39% | 22% | 35% |
| E.V. Spence | 22% | 18% | 14% | 15% | 11% |
Choke Canyon has fallen in every one of the last five Julys — 37% to 8% — which is the signature of a slow, structural drought rather than a single bad year. Lake Corpus Christi is more volatile, and its small recovery from 22% in 2025 to 35% in 2026 reflects some spring rain, but the combined Corpus Christi supply is still critically low. This is the part of Texas where "reservoir level" translates most directly into water restrictions.
Why the state average is misleading
The reason a single "Texas is X% full" figure is close to useless is that Texas has no unified water system. The wet reservoirs of the north and east — the Trinity, Sabine and Red River basins — supply Dallas–Fort Worth, Houston and East Texas, and they are full. The dry reservoirs of the south and west — the Nueces, Frio, Concho and upper Colorado — supply Corpus Christi, the Coastal Bend, San Angelo and the plains, and there is no pipeline that lets Houston's surplus reach them. A brimming Lake Livingston does nothing for Choke Canyon. So the statewide two-thirds figure is real, but the number that matters to any given Texan is their own basin's — which is why the useful view is the reservoir-by-reservoir map on the Texas page, not the average.
What reservoir levels do — and don't — tell you
- They measure supply, and the recent past. A full reservoir is water in the bank from recent wet months; a low one reflects a run of dry ones. North Texas's full lakes are carryover from a wet spring, while South Texas's low ones record years of below-normal rain over the Nueces basin. Storage is a lagging signal — it reports what has already fallen, not what the rest of the summer holds.
- "Empty" is not always drought. Barker and Addicks west of Houston normally sit near 0% — they are flood-control basins kept empty on purpose to catch storm runoff, so a low reading there is the system working, not failing. Reading a reservoir number correctly means knowing what the reservoir is for.
- They are not a heat or fire forecast. Texas summers bring extreme heat regardless of how full the lakes are, and reservoir storage is not an input to either heat risk or grid demand. Full reservoirs are good news for water utilities and farmers; they say nothing about the temperature in August.
What it means for the summer
The practical read for 2026: most Texans, by population, are entering summer with a comfortable water-supply cushion, because the reservoirs serving the big eastern and northern metros are full. But a large, drier swath of the state — the Coastal Bend around Corpus Christi, the Concho country around San Angelo, parts of the Hill Country and the Panhandle — is in a genuine multi-year drought, with several key reservoirs in single digits and one main supply, Choke Canyon, lower than it has been in at least five years. Those communities are the ones most likely to see watering restrictions and stressed supplies this summer.
The honest summary is the one the data supports: a full north and east, a parched south and west, and a statewide average that splits the difference and tells you almost nothing on its own. Whether the dry half gets relief depends on the rest of the summer's rain — which storage cannot forecast.
FAQ
What are Texas reservoir levels right now? About two-thirds of capacity statewide as of late June 2026 — roughly 90% of the normal level for early July. But it splits sharply by region: North and East Texas reservoirs like Lake Texoma and Lake Conroe are near 100%, while South Texas reservoirs like Choke Canyon are near 8%. Live figures are on the Texas page.
Is Texas in a drought in 2026? Part of it is. North and East Texas are wet and their reservoirs are full. South and West Texas — the Corpus Christi area, San Angelo, parts of the Hill Country and the Panhandle — are in a multi-year drought, with several reservoirs in single digits. It is a regional drought, not a statewide one.
Which Texas reservoirs are lowest?
Among the major tracked reservoirs, Choke Canyon (8%), Medina Lake (9%), E.V. Spence (11%) and Twin Buttes (10%) are the most depleted. The near-Houston Barker and Addicks basins read 0%, but that is by design — they are flood-control basins, normally empty.
Why is Corpus Christi's water situation so serious? The Corpus Christi and Coastal Bend supply rests mainly on two reservoirs, Choke Canyon and Lake Corpus Christi, and both are far below normal after years of dry weather over the Nueces basin. Full reservoirs elsewhere in Texas cannot help — there is no statewide network to move the water.
Where does the data come from? Federal gauges — the USGS, the US Army Corps of Engineers and the Bureau of Reclamation — mirrored with multi-year history on reservoirs.earth. Texas also publishes its own statewide dashboard, Water Data for Texas, through the Texas Water Development Board.
This is a July 2026 snapshot of Texas; for the national picture and where drought risk actually sits across the US, see the US reservoir levels edition and the neighbouring Arizona reservoir levels, July 2026. How US water-data openness ranks is on the Reservoir Transparency Index.