There is a real, published formula for how good tap water tastes — and by it, the purest water is not the best. Drinking-water researchers Devesa and Dietrich found that taste tracks mineral content, measured as total dissolved solids (TDS), and peaks in a narrow band: water tastes best at roughly 200–400 mg/L of TDS, and tastes flat below about 100 mg/L because there is too little mineral for the palate to register. We ran six US cities through that optimum: New York City, Boston, Austin, Chicago, Washington, D.C., and Los Angeles.
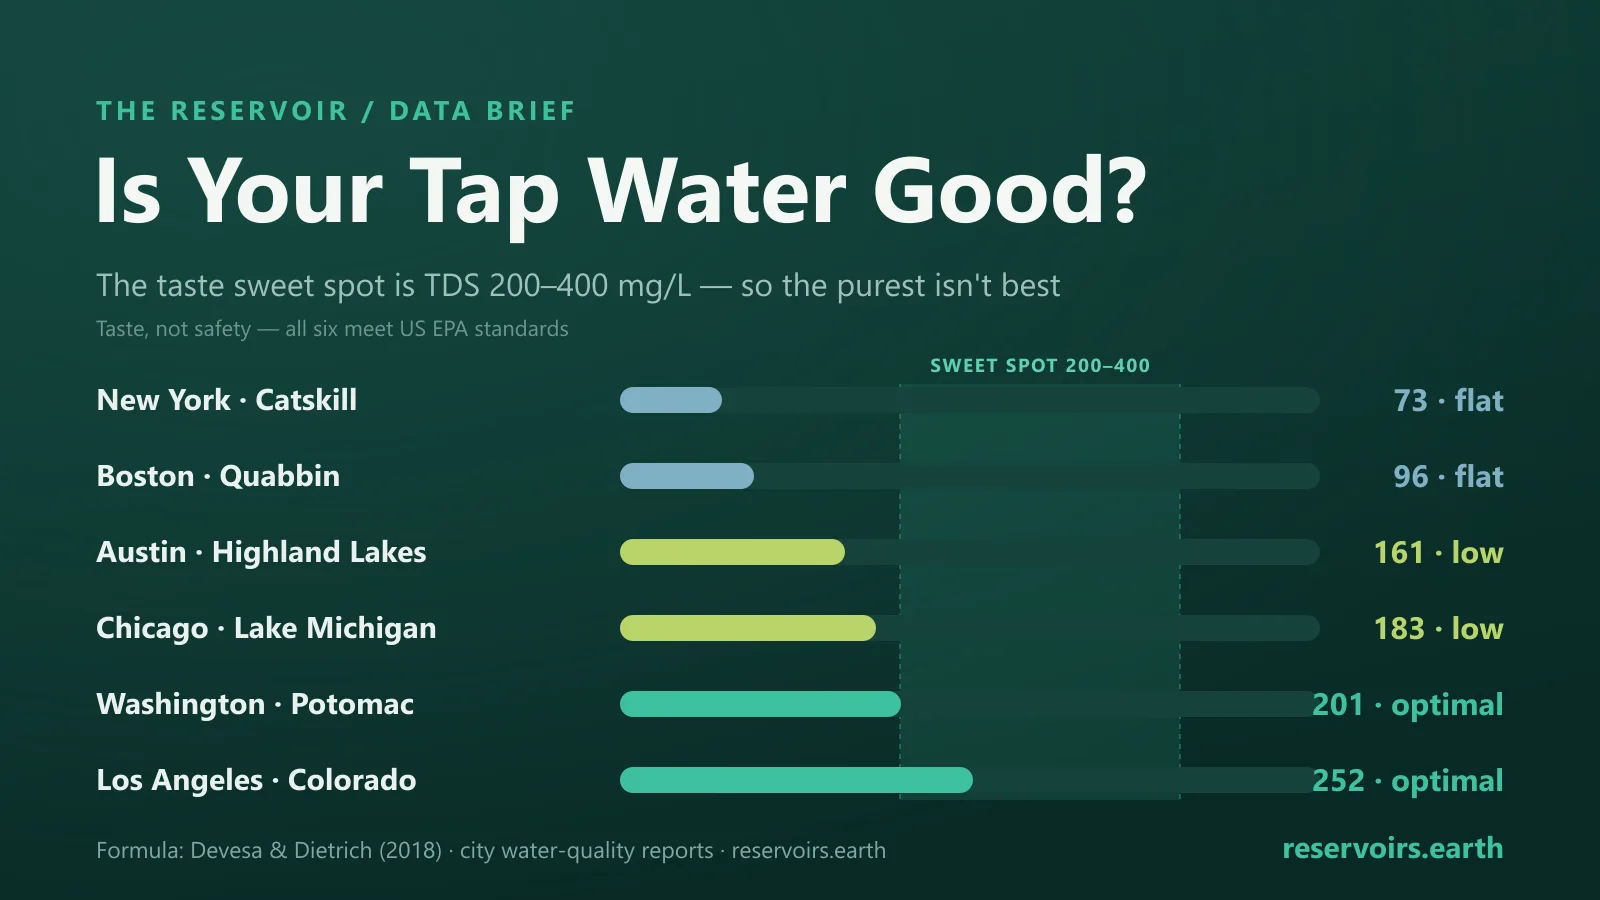
The counterintuitive result: the two most famous, most beloved soft taps — New York City (TDS 73 mg/L) and Boston (96 mg/L) — sit below the taste optimum, on the flat-leaning side. The taps that land squarely in the sweet spot are Los Angeles (252 mg/L) and Washington, D.C. (201 mg/L) — both fed by mineral-rich sources. By this formula, the best-tasting tap is not the purest; it is the one carrying the right amount of mineral.
One blunt caveat before anything else: "good" here means taste, not safety. All six cities meet US EPA drinking-water standards. Below-optimum does not mean bad — it means lower on one specific, average-preference taste curve. Clean, crisp, low-mineral water is its own virtue, and plenty of people prefer it. This piece is about palatability, not whether the water is safe to drink — it is.
Key takeaways
- There is a recent, published taste formula, and it has a sweet spot. Devesa and Dietrich (2018) found drinking-water taste peaks at roughly 200–400 mg/L TDS and falls off below ~100 mg/L, where very low-mineral water tastes flat and empty.
- "Good" means taste, not safety — read this twice. Every city below meets US EPA drinking-water standards. "Below the taste optimum" is a palatability verdict on one mineralization curve, not a health judgement. The water is safe.
- The counterintuitive result: the purest taps are not the best-tasting ones. By the formula, famously soft New York City (73 mg/L) and Boston (96 mg/L) land below the optimum, while Los Angeles (252) and Washington, D.C. (201) land in the 200–400 sweet spot.
- A tap's mineralization is inherited from its source. Upland reservoirs — New York's Catskill/Delaware system, Boston's Quabbin — yield very low-TDS water; mineral-rich sources like the Colorado River, the Potomac and the Great Lakes carry water up toward the sweet spot.
- This is one rigorous formula, not the last word. It is an average preference; individuals vary, and taste also depends on sodium and chloride, chlorine residual and temperature — which often matter more than calcium and magnesium.
The formula: the taste sweet spot
For most of the last fifty years, the conventional wisdom ran one way: less mineral is better. Bruvold and Ongerth's 1969 California Mineral Taste Study and the WHO's palatability bands both treated lower TDS as simply more excellent — the less dissolved solids, the cleaner and better the water. That is the view most people still hold, and it is the view a 2018 paper complicates.
In Devesa and Dietrich (2018), "Guidance for optimizing drinking water taste by adjusting mineralization as measured by total dissolved solids (TDS)," Desalination 439:147–154, the authors set out operative guidance for utilities tuning the taste of their finished water. Three findings do the work here:
- Very low-mineral water tastes flat. When TDS falls below about 100 mg/L, taste or "freshness" scores are at their lowest — there is too little dissolved mineral for the palate to register, so the water reads as empty or flat rather than crisp.
- The optimum is a band, not zero. The best-tasting water lands at roughly 200–400 mg/L TDS — the sweet spot. Above it, taste gradually turns minerally; below it, it thins out toward flat.
- You need a real difference to taste a difference. People generally need a TDS gap of more than ~150 mg/L to reliably taste a difference between two waters. So small mineral differences are, for most palates, invisible.
The key consequence — and the reason this reframes the whole "good water" question — is that the best-tasting tap is not the purest one. A famously soft, low-TDS supply can sit below the taste optimum and read as flat, while a moderately mineralized supply lands in the 200–400 sweet spot. Purity and palatability are not the same axis.
A few honesty guardrails. We apply Devesa and Dietrich's published optimum and thresholds — the 200–400 band, the ~100 mg/L flat point, the ~150 mg/L differentiation step — not a proprietary regression equation we don't have. It is one rigorous, recent, average-preference formula. Individuals vary widely, and taste depends on more than total mineral: sodium and chloride, chlorine or chloramine residual, and temperature all move the needle, and Devesa and Dietrich and related work note that sodium and chloride matter more to taste than calcium and magnesium. TDS is the single figure the formula uses, so it is the figure we score each city on.
The six cities, scored
We classed each city by its TDS against the optimum: below 100 mg/L = flat-leaning; 100–200 = approaching the sweet spot; 200–400 = in the sweet spot; above 400 = past the optimum. Numbers are typical published compliance figures and vary by season, source blend and even neighbourhood — we report them exactly as found.
New York City — below the optimum (flat-leaning)
- TDS: 73 mg/L → below the taste optimum
- Hardness: 32 mg/L as CaCO₃ — Soft
- pH: 7.3; LSI: −1.95 (corrosive-leaning, the chemistry behind the city's corrosion-control dosing)
- Source: the upland Catskill and Delaware reservoirs (Ashokan/Esopus, Pepacton, Cannonsville, Neversink, Rondout), 91.3% of 2025 supply, blended with 8.7% harder Croton water.
At 73 mg/L, New York's water is well below the 200–400 sweet spot — flat-leaning on this curve. That is not a knock on a tap that millions love and that is genuinely clean, crisp and consistent; it simply carries less mineral than the formula's optimum. TDS ranges 45–240 mg/L across neighbourhoods, with Croton-fed areas at the harder end.
Boston — below the optimum (the softest of all)
- TDS: 96 mg/L → below the taste optimum, the lowest of the six
- Hardness: 16 mg/L as CaCO₃ — Soft
- pH: 9.3 (raised by MWRA for corrosion control; raw reservoir water ~6.6–7.1); LSI: −0.26 — the most balanced of the six
- Source: the upland Quabbin and Wachusett reservoirs.
Boston is the softest, lowest-TDS tap here — about one grain per gallon — and the furthest below the taste optimum. It is also the most chemically balanced water of the six. As with New York, "below the optimum" is a verdict about mineral content, not quality: this is clean, well-engineered upland water that many people prefer precisely for its lightness.
Austin — approaching the sweet spot (low side)
- TDS: 161 mg/L → approaching the sweet spot
- Hardness: 78 mg/L as CaCO₃ — Moderately hard (lime-softened from a very hard raw source)
- pH: 9.7 (process/lab pH under lime softening, not the pH at your tap); LSI: +1.16 (scaling-leaning)
- Source: the Lower Colorado River of Texas / Highland Lakes (Lake Travis, Lake Austin).
At 161 mg/L, Austin is climbing toward the optimum from below. Its raw Hill Country source is very hard; Austin Water lime-softens it down to moderately hard. The 9.7 pH is the elevated process reading, not consumer pH — don't read it as taste.
Chicago — approaching the sweet spot (just below 200)
- TDS: 183 mg/L → approaching the sweet spot, just shy of 200
- Hardness: 142 mg/L as CaCO₃ — Hard
- pH: 8.3; LSI: +0.27 — balanced
- Source: Lake Michigan, very stable year to year.
Chicago sits just below the sweet-spot threshold. Its defining trait is consistency: Lake Michigan barely changes quarter to quarter, so Chicago's mineralization is the steadiest of the six. A small mineral bump and it would be inside the optimum — though, per the ~150 mg/L differentiation step, most palates wouldn't notice the difference between Chicago and a tap a few tens of mg/L higher.
Washington, D.C. — in the sweet spot
- TDS: 201 mg/L → in the sweet spot (optimum)
- Hardness: 121 mg/L as CaCO₃ — Hard
- pH: 7.6; LSI: −0.7 (corrosive-leaning)
- Source: the Potomac River, with real seasonal swing.
Washington just clears 200 mg/L and lands inside the taste optimum. A river source means seasonal movement — hardness swings roughly 96–141 mg/L across the year — so its position in the band shifts with Potomac flow, but its central figure is squarely in the sweet spot.
Los Angeles — in the sweet spot
- TDS: 252 mg/L → in the sweet spot (optimum)
- Hardness: 112 mg/L as CaCO₃ — Moderately hard
- pH: 7.7; LSI: −0.42 — balanced
- Source: a blend — soft Eastern Sierra LA Aqueduct water plus much harder, higher-TDS imported Colorado River and State Water Project water (MWD's Weymouth plant runs ~632 mg/L TDS, ~272 mg/L hardness). Varies by address.
At 252 mg/L, Los Angeles sits cleanly in the middle of the optimum — the imported mineral-rich water carries the blend up into the sweet spot. The flip side of being a blend is variability: your exact address determines how much Sierra versus Colorado water you drink, so any single Angeleno's tap can land anywhere from below the optimum to comfortably inside it. You can watch the mineral-rich end of that supply on our pages for Lake Mead and Lake Powell.
Why upland reservoirs make 'flat' water
Here is the reservoir tie-in, and it cuts against the intuition this site might seem to invite. A tap's mineralization is inherited almost entirely from its source. Upland reservoirs — New York's Catskill/Delaware system, Boston's Quabbin — collect rain and snowmelt off low-mineral upland catchments. The water that comes off those hills is clean and very low in dissolved solids. It is exactly the water the old "lower-is-better" view prized most.
But by the Devesa-Dietrich formula, that upland purity lands below the taste optimum — flat-leaning. The waters that hit the 200–400 sweet spot are the ones that pick up mineral on the way: the Colorado River carving through the Southwest (Los Angeles), the Potomac running off a mineral-rich basin (Washington), the Great Lakes holding a deep, stable mineral load (Chicago). So the formula rewards mineral-rich sources, not upland-reservoir purity. The reservoirs that make the "best" water on the old scale make the "flattest" water on this one — the same source, judged by two opposite yardsticks.
So which city wins?
Ranking by proximity to the 200–400 mg/L optimum, and being honest that this is one metric:
- Los Angeles (252 mg/L) — squarely in the sweet spot. Best-placed by the formula, though its blend varies by address.
- Washington, D.C. (201 mg/L) — just inside the optimum. River-sourced, so its exact position drifts with the season.
- Chicago (183 mg/L) — approaching, just below 200, and the steadiest of all.
- Austin (161 mg/L) — approaching from the low side, lime-softened from a hard raw source.
- New York City (73 mg/L) — below the optimum, flat-leaning on this curve.
- Boston (96 mg/L) — the furthest below the optimum, the softest of the six.
Read that ranking carefully, because it inverts the popular consensus. New York and Boston are routinely named among the best-tasting tap water in America, and by every account they are excellent — clean, crisp, low-chlorine, remarkably consistent. The formula does not call them bad; it places them below one specific mineralization optimum. Popular acclaim and the Devesa-Dietrich curve genuinely disagree here, and the honest thing is to hold both: many people love soft upland water, and one rigorous taste formula says the sweet spot sits higher in mineral than those famous taps reach. It is a single yardstick, not a verdict.
What else changes taste
The formula uses TDS because it is the best single mineralization proxy, but several things outside it move taste as much or more:
- Sodium and chloride. Devesa, Dietrich and related work find these ions affect taste more strongly than calcium and magnesium. Two waters at the same TDS can taste quite different depending on which salts make up that total.
- Chlorine and chloramine. Disinfectant residual is the taste and smell people most often notice. It largely disappears after a few hours in an open jug in the fridge — a treatment artefact, not source chemistry.
- Temperature. The same water tastes markedly better cold; chilling suppresses both chlorine odour and faint mineral notes. If a "good" tap tastes off, it is usually warm, freshly chlorinated water rather than its mineralization.
FAQ
So is New York City water not good? It is genuinely excellent and widely beloved — clean, crisp, low-chlorine and consistent, fed by upland reservoirs. By the Devesa-Dietrich taste formula its TDS of 73 mg/L sits below the 200–400 mg/L optimum, on the flat-leaning side. That is one mineralization metric, not a quality verdict, and many people prefer exactly that light, soft profile. It is also fully safe and EPA-compliant.
What is the ideal TDS for taste? Per Devesa and Dietrich (2018), drinking-water taste peaks at roughly 200–400 mg/L of TDS — the sweet spot — and falls off below about 100 mg/L, where water tastes flat. Of our six cities, Los Angeles (252) and Washington, D.C. (201) land in that optimum.
Does low-TDS water taste bad? Not bad — flatter. Below about 100 mg/L there is too little dissolved mineral for the palate to register, so very pure water reads as empty rather than crisp. Plenty of people prefer that lightness; the formula simply scores it below the optimum, not as unpleasant.
Is more minerals always better? No. Taste improves with mineral only up to the 200–400 mg/L band; above it, water turns minerally and eventually slightly bitter. The formula describes an optimum, not "more is better." And because most palates need a TDS gap of more than ~150 mg/L to notice a difference, small mineral changes are usually imperceptible.
Does good taste mean healthy or safe? No. Taste and safety are separate questions. All six cities meet US EPA drinking-water standards regardless of where they fall on the taste curve. "Good" in this article means palatability, not health — water can taste flat or minerally and still be perfectly safe to drink.
Want the sources behind the water? See the US overview for live reservoir levels, and our methodology piece on how we get our US data. Taste optimum from Devesa & Dietrich (2018), Desalination 439:147–154. Source-water values are typical published compliance figures and vary by season and source blend.