Reservoirs.earth exists to grade how openly countries publish their reservoir data, so it is only fair that we are open about how we get ours. This is Part 2 of a series on where our numbers actually come from, and the United States is the exact inverse of Part 1. India was a locked door: one national system, geo-restricted, encrypted, behind a login. The United States is the opposite problem. Almost nothing is hidden — most of it is genuinely open — but there is no single source. The data is scattered across a half-dozen federal agencies, each with its own units and quirks, and for some states the reservoirs that matter most sit in none of the federal feeds at all. Run the standard federal stack over New York and you get essentially one empty flood-control dam; the reservoirs that supply New York City are run by the city and appear nowhere in the national data. Here is what assembling the US picture actually took.
Key takeaways
- The US is open but scattered. No single agency holds the country's reservoir data; we stitch together CDEC, USGS, the Army Corps and the Bureau of Reclamation into the US overview, normalising every unit to million cubic metres.
- New York's real water is in no federal feed. The federal stack returns one deliberately-empty flood-control dam for the state, so we built a dedicated scrape of the city's own reservoir page to recover the eight Catskill and Delaware reservoirs at New York.
- Capacity had to be recovered by coordinates, not names. Dozens of US dams share a name, so we match each reservoir against the National Inventory of Dams by location to find its true capacity — see Lake Mead.
- We are explicit about what we leave out. Dams that report only elevation, tiny ponds, flood-control structures and stale gauges are excluded with a plain-English reason rather than shown as a misleading number.
- Coverage is wide and honest: 517 reservoirs across 36 states. Late June 2026 shows the split starkly — New York is near 88% full overall (Ashokan alone about 93%) while Lake Powell sits near 23%.
From a locked door to a scattered map
Part 1 was about access. India's data existed but could not be reached: its national systems refuse connections from outside the country, the front-door bulletin was frozen for over a year, and the live feed comes back encrypted and behind a login. The whole difficulty was getting in.
The United States flips every one of those problems. The doors are open. The agencies publish, the APIs answer a request from Spain without complaint, and most of the data is current. The difficulty is that there is no single door — there are many, and they do not agree with each other. The work in India was circumvention; the work in the US is reconciliation. And there is a second, sharper twist: in a couple of states, the most important reservoirs are not in the federal data at all, because the agency that runs them is a city, not Washington. That is the through-line of this instalment.
The federal patchwork
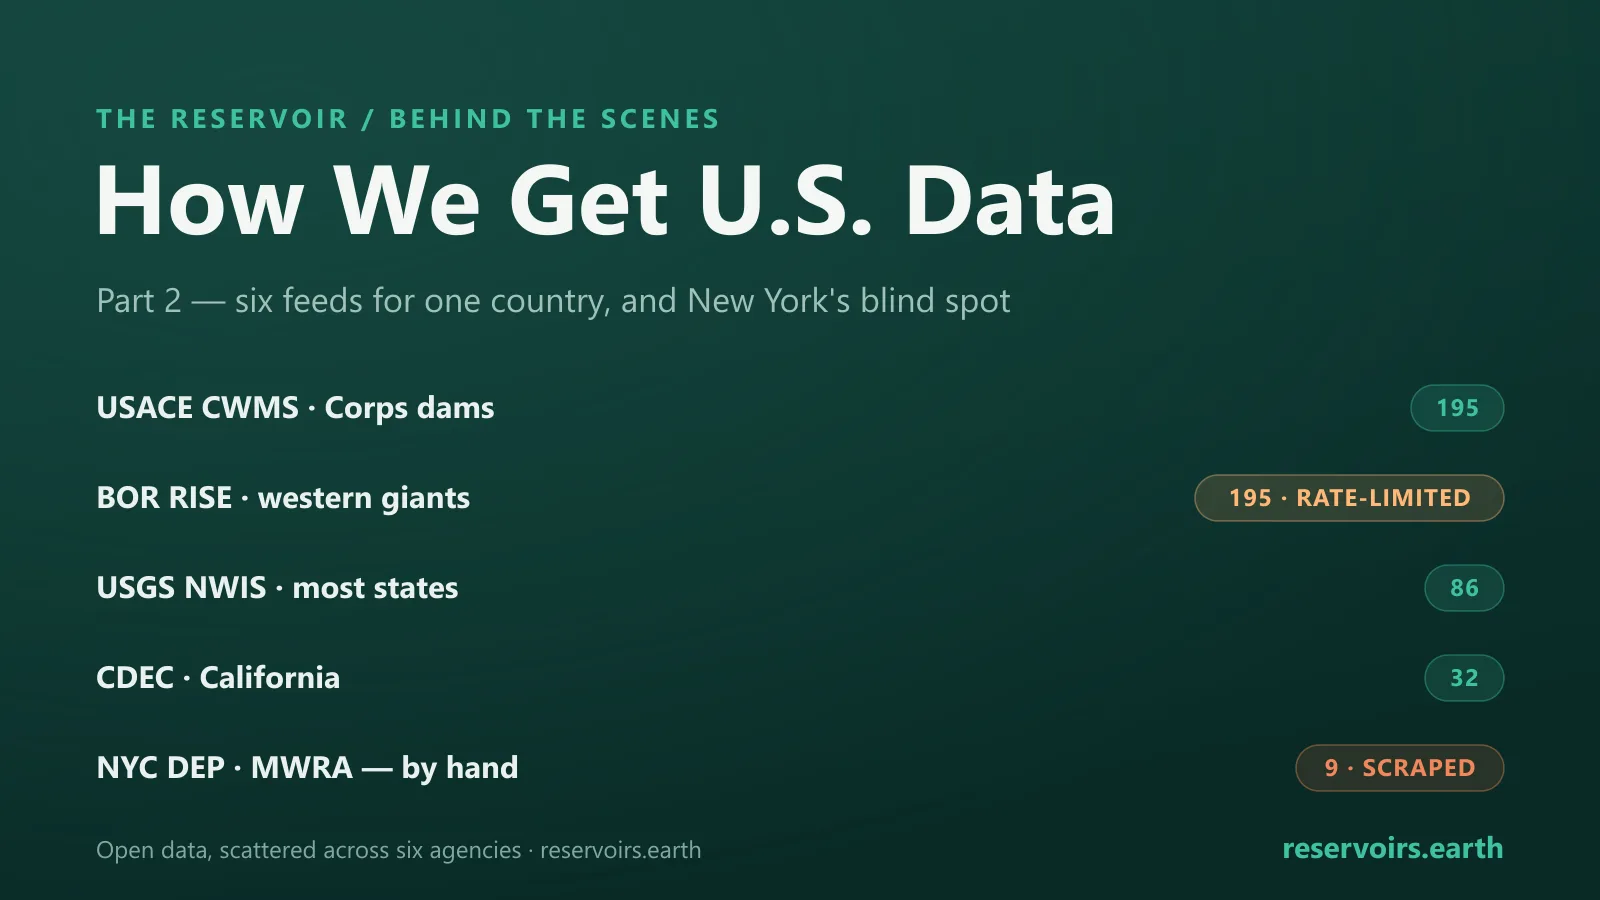
The bulk of US reservoir data comes from four federal sources, which our build pulls daily in a run of about 80 minutes. Each covers a different slice of the country:
- CDEC — the California Data Exchange Center, run by California's Department of Water Resources. This is where California's headline reservoirs live — Shasta, Oroville, Folsom. We use about 32 reservoirs from it.
- USGS NWIS — the US Geological Survey's national water service. The general-purpose workhorse. We query parameter code 00054 ("reservoir storage, acre-feet") for lake and reservoir sites and take roughly 86 reservoirs from it. That single parameter code matters more than it looks, as the "why we leave things out" section explains.
- USACE CWMS — the Army Corps of Engineers' Corps Water Management System. Our single biggest source, at about 195 reservoirs, organised across roughly 16 district offices (New England, New York, Baltimore, Detroit and others). We read each site's ".Stor." storage timeseries, which the Corps publishes in cubic metres.
- BOR RISE — the Bureau of Reclamation's Reservoir Information System. The big western reservoirs — Lake Mead, Lake Powell, Flaming Gorge. A JSON API with a deeply nested hierarchy: location, then catalog-record, then catalog-item, then result. Another roughly 195 reservoirs.
Every one of these agencies uses its own unit — acre-feet, cubic metres, billion gallons — so every reading is normalised to million cubic metres (hm³) before it goes on the map. The seams between the four feeds are exactly where the work is: a reservoir can sit in two systems under two names, or fall in the gap between all of them.
The reservoirs that fought back
Open data is not the same as easy data, and several US reservoirs put up a real fight.
The giants timed out. BOR RISE choked on its own biggest lakes. Lake Mead carries about 32,000 records and Lake Powell about 23,000, so the data endpoint took over 30 seconds, returned nothing, and the reservoir was silently dropped. For a while that meant an entire state — Nevada — briefly lost its defining reservoir. We fixed it by windowing each request to roughly the last five years and caching the stable item IDs so we are not re-discovering the catalog every day. BOR also rate-limits by IP after a heavy run, so a full re-discovery could lock us out for a cooldown; caching the IDs turns each daily run into one cheap call instead of a full crawl.
The Corps paginated backwards. An early version of our CWMS reader only fetched the oldest page of data, which quietly froze some reservoirs at their 2021 value while the rest of the country moved on. The fix was a wide window plus a second, recent request, so we get both the history and today's number.
There is more than one Hoover Dam. The national records contain dozens of identically named dams, so a reservoir cannot be matched to its real capacity by name — match on the name and you can hand a reservoir the wrong lake's capacity entirely. We solve this by matching on coordinates against the National Inventory of Dams, a register of about 22,000 dams, to recover each reservoir's true capacity. Before we did that, the US was the project's embarrassing exception: lacking a real capacity figure, we used "the maximum of the last five years" as a stand-in, which made every US reservoir look about 100% full. Coordinate-matching against the NID is what turned the US from a wall of green into honest percentages — including the current western lows: late June 2026 has Lake Mead about 26% full (near its chronically low normal) and Lake Powell about 23%.
New York's blind spot
New York is the clearest case of the scattered-map problem, and it is worth dwelling on.
Run the entire federal stack over New York State and you get essentially one dam: Mount Morris Dam, an Army Corps flood-control structure on the Genesee River that is deliberately kept empty except during floods. Taken at face value, New York would display a single dam at about 0% — a misleading "critical red" for one of the best-watered states in the country. The federal feeds are not wrong; they simply do not contain New York's real water.
Because the reservoirs that actually matter in New York — the ones supplying New York City's roughly 8 to 9 million people — are the Catskill and Delaware system: Ashokan, Pepacton, Cannonsville, Neversink, Rondout, Schoharie, plus the older Croton system. These are run by NYC DEP, the city's Department of Environmental Protection, Bureau of Water Supply — a municipal agency that appears in none of the federal feeds.
So New York needed its own dedicated integration. We scrape NYC DEP's public "Current Reservoir Levels" page (server-rendered HTML), read each reservoir's "Available Capacity" in billion gallons and its "Usable Storage" percentage, and convert billion gallons to million cubic metres. We did the same for Massachusetts — Quabbin and Wachusett — via the MWRA page. The scrape is snapshot-only (no deep history), resilient (a failed scrape skips just that source while the federal data still publishes), and idempotent.
The result is the point of the whole exercise: New York now shows 8 reservoirs holding about 2.2 km³ at roughly 88% full — Ashokan alone is about 93% — instead of one empty flood-control dam. The federal stack covers about 49 states; New York's real water had to be fetched from the city.
Why we leave some reservoirs out
Wide coverage is only honest if we are clear about the gaps. We deliberately exclude a reservoir, with a stated reason, in seven situations:
- No storage number. USGS only returns reservoirs that publish parameter 00054 (stored volume). A dam that reports only its water-surface elevation or its outflow is invisible to us. Grand Coulee on the Columbia — one of the largest dams in the United States — has no clean storage feed we can use (Reclamation carries only sedimentation surveys for it, and its USGS gauge does not report the storage parameter), so it is currently left out.
- Too small. We skip reservoirs under about 1,000 acre-feet. Below that they are operational ponds, not regional water storage, and they only add noise.
- Flood-control dams. Structures like Mount Morris are kept empty by design, so a "percent full" is meaningless. We mark them N/A with a plain-English reason rather than show a misleading red 0%.
- Dead feeds. A gauge that has stopped reporting — decommissioned or broken — is excluded and flagged, not frozen at its last value.
- Sedimentation surveys. Some Reclamation records are one-off survey reports, not live storage; we exclude those.
- Stale readings. Anything older than 45 days renders as N/A rather than being passed off as current.
- Unknown capacity. If a reservoir cannot be matched to a real capacity, we flag its figure as estimated rather than invent false precision.
These exclusions are why the count we display — 517 reservoirs across 36 states — is smaller than the larger raw set our crawlers first pull from the feeds: the figure on the site is what survives after the gaps above are removed, not the full catalog of everything the agencies list.
Behind all of this sits a safety net. If any single source suddenly drops more than about 40% of its reservoirs — a flaky-feed failure of the kind that once collapsed BOR from 142 reservoirs to 0 — the build fails and the site keeps its last good snapshot. A bad fetch never silently wipes coverage.
What this means for the data you see
The US is our widest single-country coverage: 517 reservoirs across 36 states after exclusions, assembled from four federal feeds plus two municipal scrapes, every reading converted to a common unit and matched to its true capacity through the National Inventory of Dams. Where we have a clean storage feed, the number is real and current; where we do not, we say so rather than guess.
The clearest illustration of why all this stitching is worth it is the June 2026 edition: the same country, at opposite ends of the water map. New York's Ashokan sits near 93% full while the western giants Lake Mead (about 26%, near its chronically low normal) and Lake Powell (about 23%) hold near their chronic lows. You only see both halves of that picture because we went looking past the federal stack — which is exactly the kind of completeness our transparency index scores the US on.
FAQ
Where does reservoirs.earth get its US reservoir data? From four federal sources — CDEC for California, USGS NWIS (parameter 00054) for general lake storage, the Army Corps' CWMS, and the Bureau of Reclamation's RISE — plus dedicated scrapes of NYC DEP and the MWRA for reservoirs no federal feed carries. Everything is normalised to million cubic metres and shown on the US overview.
Why isn't there a single US reservoir database? Because responsibility is split: Reclamation runs the big western projects, the Army Corps runs flood-control and navigation dams, California runs its own exchange, USGS gauges much of the rest — and major city supplies like New York's are run by municipal agencies outside all of them. Open data, but no single front desk.
Why did New York need special treatment? The federal stack returns essentially one dam for New York — Mount Morris, a flood-control structure kept empty by design — which would read as a misleading 0%. The reservoirs that actually supply New York City are the Catskill and Delaware system, run by NYC DEP, so we scrape the city's own page and now show eight reservoirs at about 88% full.
How do you know each reservoir's real capacity? We match each reservoir by coordinates against the National Inventory of Dams, a register of about 22,000 dams, because dozens of US dams share a name and cannot be matched reliably by name alone. Before we did this, missing capacities forced a "max of the last five years" stand-in that made every US reservoir look full.
Why are some big dams, like Grand Coulee, missing? Because they do not publish a storage volume in a feed we can read — they report elevation or outflow instead, or only one-off sedimentation surveys. Rather than fabricate a storage figure, we leave the reservoir out and flag the reason.
How current is the US data? The federal feeds and municipal scrapes refresh on a daily pipeline, and anything older than 45 days is shown as N/A rather than passed off as current. If a source loses more than about 40% of its reservoirs in one run, the build fails and the last good snapshot is kept.
This is Part 2 of a series on how reservoirs.earth sources its data. Read Part 1 on India, see the live numbers on the US overview and the June 2026 edition, and for the principle behind it all, why reservoir data must be public.