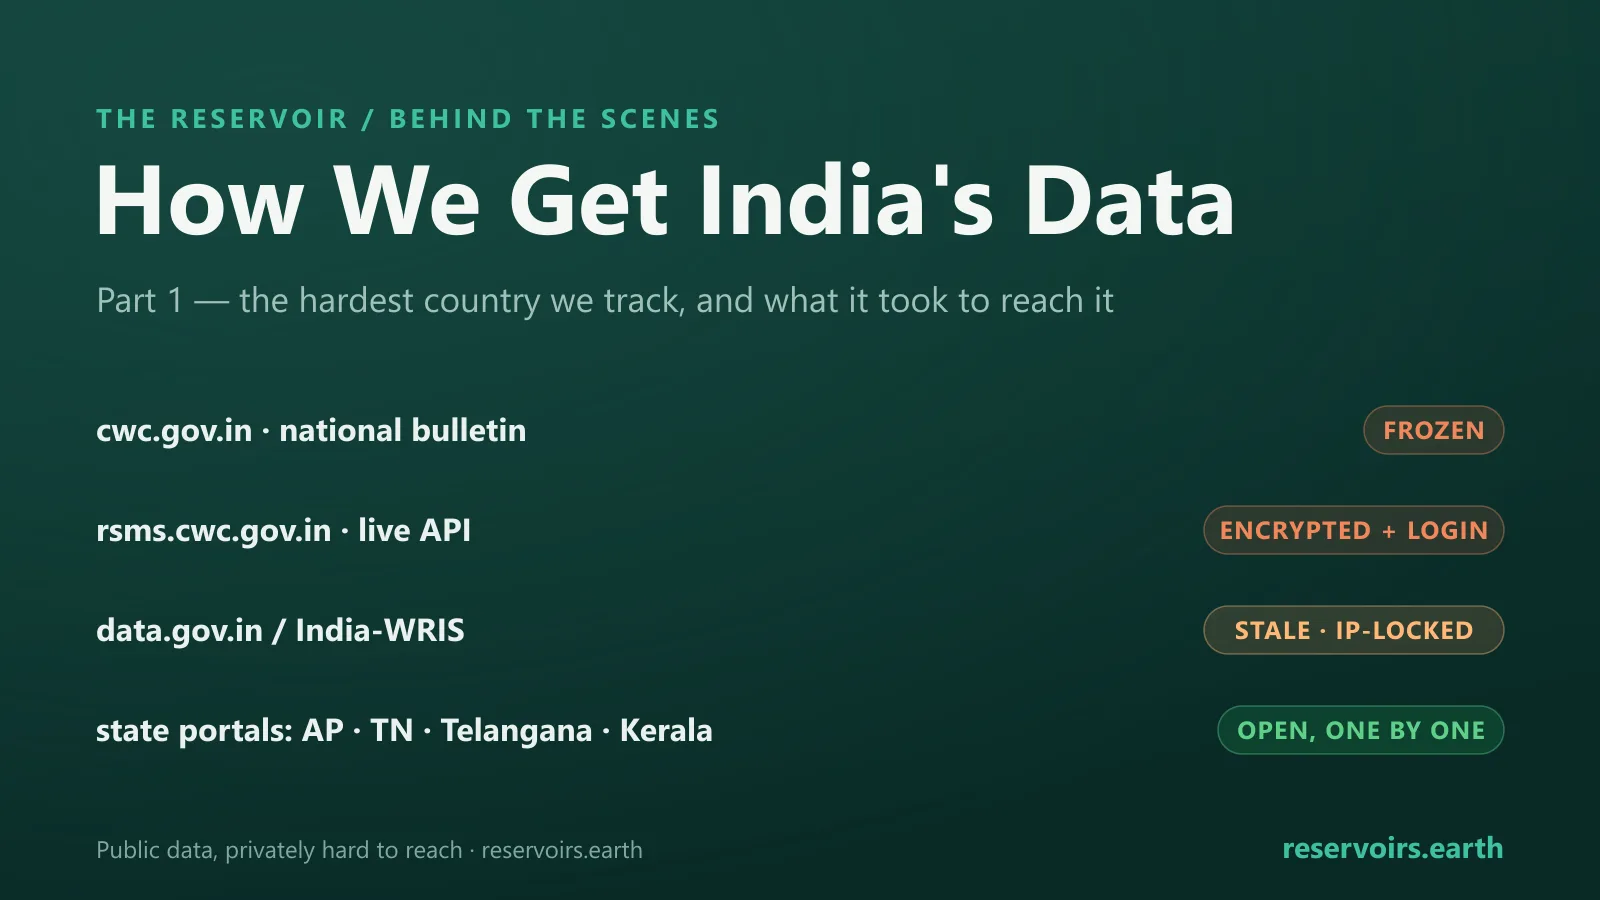
Reservoirs.earth exists to grade how openly countries publish their reservoir data, so it is only fair that we are open about how we get ours. This is the first in a series on where our numbers actually come from — and we are starting with the country that fought us hardest: India. Getting India's reservoir levels has meant a dead official page, a live national system locked behind encryption and a login, government domains that will not even resolve from outside the country, and — in the end — building a separate scraper for half a dozen different state water portals. We run this project from Spain, and India's servers do not answer to a Spanish address. Here is the honest version of what that took.
Key takeaways
- We grade countries on data transparency, so we publish our own process too. India is Part 1 because it was the hardest country we track; its own openness score reflects that on the Reservoir Transparency Index.
- India's "public" national data is, in practice, locked. The obvious official bulletin page sat frozen for over a year, and the live system returns its figures as an encrypted payload behind a login.
- Geography is the first wall. India's official sources refuse connections from outside the country, so from Spain the front doors simply do not open — reaching them needed an Indian IP and, ultimately, scraping from inside India.
- The way in was the states, not the centre. Where the national door is locked, several state water portals are open — Andhra Pradesh, Tamil Nadu, Telangana, Kerala, Bihar — each a different system that had to be reverse-engineered on its own terms.
- We are transparent that the result is partial. India is the one country we cannot refresh in our automated daily pipeline; the national bulletin is pulled by hand, weekly, over a VPN. That partial, hard-won coverage is exactly why India scores low on our index, and we do not hide it. See it live on the India reservoir levels page.
We grade openness — so here is ours
Most of what we publish is a verdict on someone else's transparency. The Reservoir Transparency Index scores 194 countries on whether you can actually find out how much water their reservoirs are holding. It would be hypocritical to be a black box about our own methods, so this series documents, country by country, how the data behind the maps is obtained — including the parts that are ugly.
India earns the first entry because no other country came close in difficulty. It is also the clearest illustration of a point the whole project is built on: "public" and "accessible" are not the same thing. India's reservoir data is, on paper, published. Getting at it took months.
The home-field problem: we work from Spain
The first wall is geography. India's national water systems are geo-restricted — they answer requests from Indian IP addresses and quietly refuse, time out, or reset connections from everywhere else. From our base in Spain, the national endpoints behave as if they do not exist.
That single fact reshapes everything. Every other country we cover can be fetched from a server anywhere; India effectively has to be fetched from inside India. In practice that meant routing through Indian VPN endpoints and, where that was not enough, getting help from someone scraping on the ground — an India-based data scraper — to reach what an outside IP never could. Even then it was fiddly: different government hosts accept different outbound addresses, so the exit point that unlocked one portal would be refused by the next.
There was a smaller, stranger version of the same problem at the DNS layer. Some Indian government domains would not even resolve from inside the VPN — the address lookup simply returned nothing — so we had to look those addresses up through a separate channel and connect to them directly. The data was behind not one locked door but several, in series.
The front door was frozen
The textbook source for India is the Central Water Commission (CWC), which publishes a weekly Reservoir Storage Bulletin tracking the country's major reservoirs. For a long stretch, the obvious public page for that bulletin served the same PDF over and over — frozen on a date in April 2025 — while the calendar rolled on past it. The official front door was, for practical purposes, stuck.
This is where we have to be transparent about our own mistake. Early on, we mirrored that frozen bulletin and — through a bug in how we stamped reading dates — served those April 2025 numbers labelled with current dates. For a while, our India figures looked fresh when they were a year stale. When we caught it, we re-dated every India reading honestly, wrote down exactly what had gone wrong, and treated it as a lesson rather than something to bury. A project about transparency does not get to hide its own errors; the same instinct sits behind our public post-mortem on grading 194 countries.
The live data was locked
There is a live national system — CWC's Reservoir Storage Monitoring System — and it does carry an up-to-date weekly bulletin. But it is a single-page web app whose data comes back as an encrypted payload, and the actual per-reservoir storage figures sit behind a login. An anonymous request for a specific reservoir's number just returns an error. Even the weekly bulletin PDFs, which are meant to be public, were buried deeply enough that pulling them reliably took weeks of trial and error — including the small indignity of not being able to register an account with our own email addresses.
We will not publish a step-by-step recipe for working around a government system's access controls; that would be irresponsible, and it is not the point. The point is the gap: a public-interest dataset, produced with public money, that an ordinary person — or an ordinary computer — cannot simply read.
The open-data dead ends
The natural fallbacks closed one by one:
- data.gov.in, India's open-data portal, does publish a reservoir dataset — but the series runs out at December 2023, and the API resource we needed had expired into a "meta not found" error. Useful for history, useless for "today."
- India-WRIS, the national water-resources information system, has a real machine-readable backend — but it is IP-restricted like the rest, so it times out or refuses from outside India.
Each looked promising for a day and then shut. By the end, the lesson was clear: the national level was not going to give us a clean, current feed.
The way in: India's states
The breakthrough was to stop knocking on the national door and go to the states. India's reservoirs are operated and monitored partly at the state level, and several state water portals are open, reachable, and — crucially — current. The catch is that every one of them is a different system, so each needed its own bespoke integration:
- Andhra Pradesh runs a public water-audit portal that returns clean reservoir storage, in TMC (thousand million cubic feet), for both its own dams and several it shares with neighbours — our most reliable single source inside India.
- Tamil Nadu publishes through a geoportal that is itself IP-gated, reports storage in million cubic feet, and lists reservoir names in capital letters that have to be aliased to ours. It is where our live Mettur Dam number comes from.
- Telangana exposes an XML web service whose live feed resets to zero at local midnight — read it at the wrong hour and every dam looks empty — so we guard against the zeros and fall back to the previous day's value.
- Kerala is covered by a community-maintained dataset on GitHub; we trust only its percentage field, because the underlying volume units did not line up with ours.
- Bihar serves a plain web page with reservoir names in Hindi and capacities in acre-feet, so it needed a Hindi-to-English name map and yet another unit conversion.
- Odisha is still beaten us: its portal resets every connection we make, even from inside India. Some doors stay shut.
Stitched together, these portals let the most-watched Indian reservoirs refresh far more often than the national bulletin alone would allow.
A zoo of units and names
A theme runs through all of this: nothing is standardised. Across India's sources we met storage measured in TMC, million cubic feet, acre-feet, and billion cubic metres, reservoir names in two scripts and several spellings, and the same dam appearing under different aliases in different systems. Every reading we ingest is normalised to a single unit (cubic hectometres, equivalent to million cubic metres) and matched to one canonical reservoir, or it does not go on the map. A surprising amount of the work was not "fetching data" at all — it was making four incompatible sources agree on what a number means.
What this means for the data you see
We would rather tell you the limits than imply a coverage we do not have:
- India is the only country we cannot fully automate. Every other source runs in a scheduled daily pipeline; India's national bulletin is pulled by hand, weekly, over an Indian VPN, because no automated server abroad can reach it.
- Coverage is partial, and we score it honestly. Only a fraction of India's total reservoir capacity is currently obtainable as fresh data. That is precisely why India sits low on our own Reservoir Transparency Index — not because India holds little water, but because so much of the number is locked away.
- Where the data is fresh, it is genuinely fresh. The state portals and the live national bulletin give real, recent readings for the reservoirs we do cover, with multi-year history on each reservoir's page and on the India overview.
Why we keep doing it
India is the world's most populous country and one of its largest irrigated-agriculture economies; its reservoirs decide the post-monsoon crop, city water supply, hydropower, and the recurring Cauvery and Krishna water disputes. The data matters too much to skip just because it is awkward to obtain. And there is a principle in it: when public-interest data is technically published but practically unreachable, documenting how unreachable it is becomes part of the transparency work itself. This is the same argument we make for why reservoir data should be public — only told from the inside.
FAQ
Where does reservoirs.earth get its India data? From a mix of sources, because no single one works: the Central Water Commission's weekly national bulletin (pulled manually over an Indian VPN) plus several live state water portals — Andhra Pradesh, Tamil Nadu, Telangana, Kerala and Bihar — each integrated separately. The combined live picture is on the India page.
Why is India harder than other countries? Its national sources are geo-restricted to Indian IP addresses, the obvious public bulletin page was frozen for over a year, and the live system returns its figures encrypted and behind a login. Reaching current data required working from inside India rather than from our base in Spain.
Did you hack a government system? No. We pulled the same weekly bulletins the government publishes and read open state portals; we deliberately do not publish techniques for circumventing access controls. The story here is that public data was needlessly hard to reach, not that anything private was taken.
Is India's data on reservoirs.earth reliable? For the reservoirs we cover, yes — the readings are official and dated. But coverage is partial and the national feed is manual, which is why India scores low on our transparency index. We flag stale readings rather than passing them off as current.
Which country is next in this series? We are writing up every country where sourcing the data was a real fight. India was Part 1 because it was the worst; the next instalments cover the others, including the ones that hide their data on purpose.
This is Part 1 of a series on how reservoirs.earth sources its data. For the why behind it, see why reservoir data must be public and how we graded 194 countries; for India's live numbers, see the India reservoir levels page and the June 2026 edition.