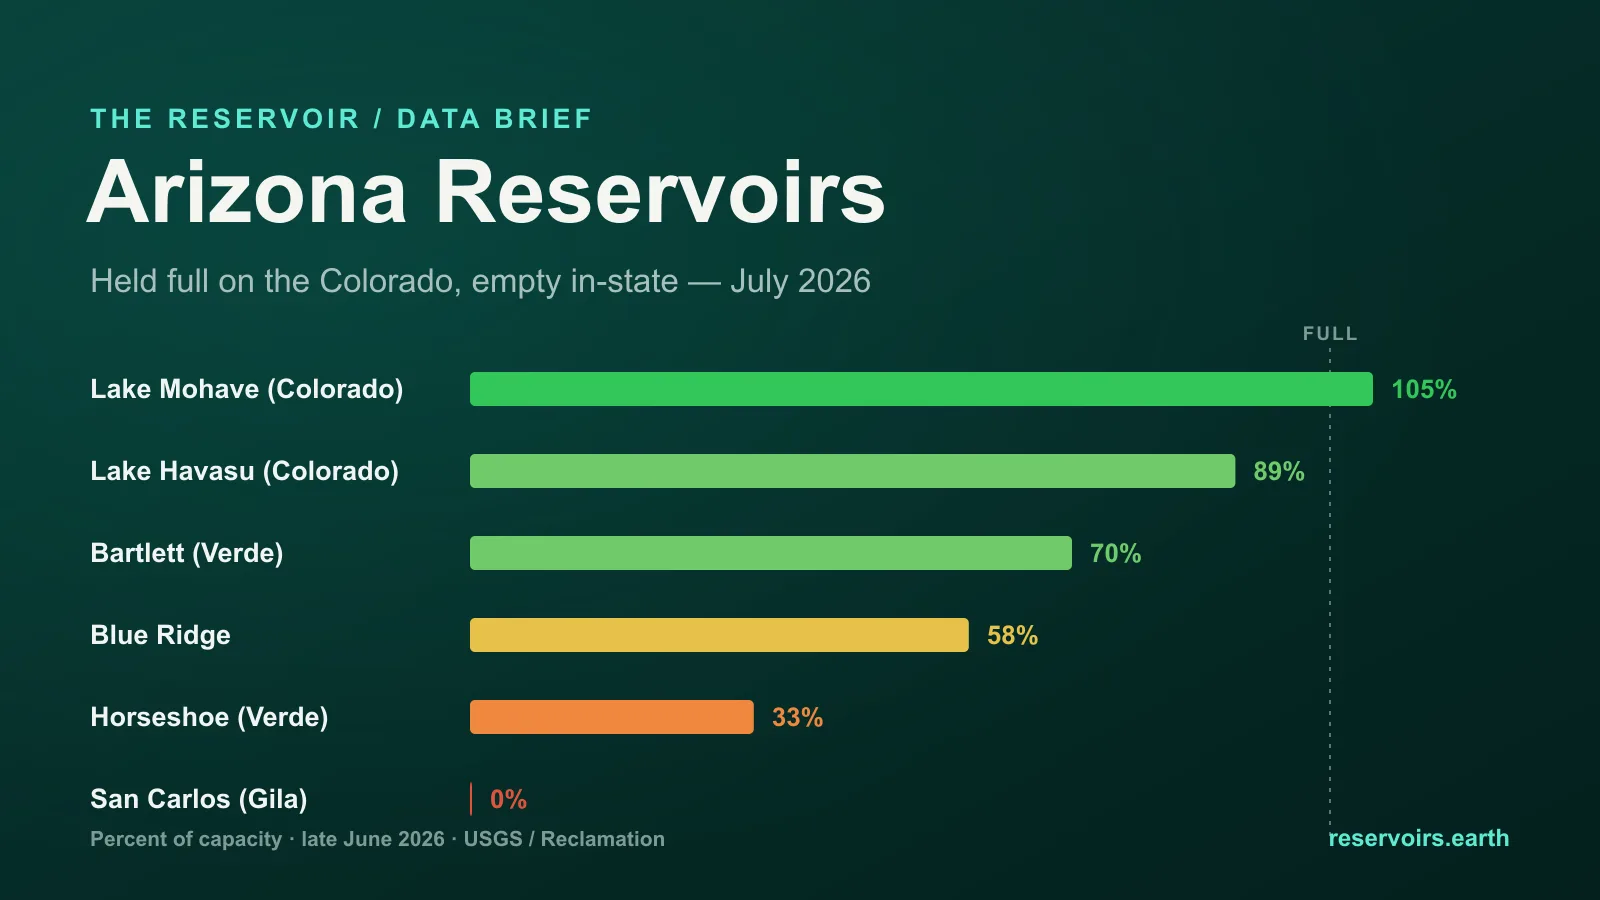
Arizona's tracked reservoirs read about 64% full at the start of July 2026, and the average hides two opposite stories. Two Colorado River reservoirs — Lake Mohave (105%) and Lake Havasu (89%) — sit near the top by design, because the US Bureau of Reclamation operates them to regulate river flow between the big dams, not to store water for dry years. The reservoirs that actually store Arizona's own water are running down: Roosevelt Lake, the largest reservoir wholly inside the state and the anchor of the Salt River Project system that supplies metropolitan Phoenix, was 39% full on 1 July 2026 — down from 90% in July 2024 — and San Carlos Reservoir on the Gila was empty. The water Arizona ultimately lives on, its Colorado River allocation banked in Lake Mead (26%) and Lake Powell (22%), sits in two reservoirs that line Arizona's borders but are chronically low. Live figures are on the Arizona page; the national picture is on the United States page.
Key takeaways
- The state average is not a drought signal. Arizona's ~64% is pulled up by two Colorado River regulating reservoirs, Lake Mohave and Lake Havasu, that Reclamation keeps near full on purpose. They are not a measure of Arizona's water security. Live figures are on the Arizona page.
- Roosevelt Lake is the number that matters, and it is falling. The largest reservoir wholly inside Arizona held 39% of capacity on 1 July 2026, against 57% in July 2025 and 90% in July 2024. It stores 2,012 hm³ — more than San Carlos, Bartlett, Horseshoe and Blue Ridge combined.
- The rest of the Salt chain stays full because it is small. Apache, Canyon and Saguaro sit above 90%, but together they hold 460 hm³ — under a quarter of Roosevelt. They are the hydro and re-regulating lakes below the big dam, not the state's water bank.
- In-state storage elsewhere is low. San Carlos on the Gila is about 0% full, and the Verde River reservoirs are mixed: Bartlett ~70%, Horseshoe ~32%.
- Arizona's real water bank is low. The state's Colorado River supply is stored in Lake Mead (
26%) and Lake Powell (22%) — chronically depleted, and the reason Arizona has faced formal Colorado River shortage cuts.
- A flat 105% is the tell. Lake Mohave has read almost exactly 105% every July for five years running. A reservoir that never moves is being operated to a target, not filling and emptying with the weather.
Where the data comes from — and what it misses
There is no single national US reservoir bulletin, and Arizona shows why the source matters as much as the number. Three publishers cover the state between them: the US Bureau of Reclamation for the Colorado River reservoirs (Mohave, Havasu, and Mead and Powell); the US Geological Survey (USGS) for the Gila and Verde reservoirs (San Carlos, Bartlett, Horseshoe); and the Salt River Project (SRP) for the four Salt River reservoirs above Phoenix.
The Salt River chain was missing from this page until 2 August 2026, and the reason is worth stating plainly, because it is the transparency problem this site exists to document. USGS publishes no storage series for Roosevelt, Apache, Canyon or Saguaro — its Arizona storage gauges cover only the Verde, Gila and Colorado systems — and Reclamation's RISE database holds Theodore Roosevelt Dam as a location with sedimentation surveys but no time series. The live data exists, and is good: SRP publishes daily storage, elevation and percent-full for all six of its reservoirs through its Watershed Connection portal, with a public API and three years of history. It simply sits outside the federal feeds that most national coverage mirrors. We now read it directly, which added 2,472 hm³ — 37% of Arizona's tracked capacity — to this page in one step. Every figure below is dated; the live numbers and each reservoir's chart are on the Arizona page.
The current picture (as of 1 July 2026)
Sorted by fill, with capacity alongside, Arizona's ten tracked reservoirs separate into three groups — and the fullest ones are the smallest or the least meaningful.
Read the capacity column alongside the fill column and the state average falls apart. The two reservoirs at the top mean the least for drought: Lake Mohave and Lake Havasu are "run-of-river" regulating reservoirs behind Davis and Parker dams, held within a narrow band so they can pass Colorado River water downstream to California, Arizona and Mexico on schedule. They stay near full in wet years and dry years alike, and between them they are 41% of the capacity in the table.
The three Salt River lakes reading 92–96% are a different kind of decoy. Apache, Canyon and Saguaro are the hydroelectric and re-regulating lakes strung below the big dam, and they are small: 460 hm³ between the three of them. Across our full three-year record of daily readings, Canyon Lake has never once dropped below 90%. That is not a wet-year signal; it is what a reservoir looks like when it is operated to a level.
The lines that carry real information are the bottom three. Roosevelt Lake — 2,012 hm³, the largest reservoir wholly inside Arizona and the one the Salt River Project actually banks water in — is at 39%. San Carlos is empty. Horseshoe is at 32%. Those three hold 3,251 hm³ of capacity, about half the state's total, and together they are roughly a quarter full.
The reservoir that never moves
The clearest evidence that the headline is an operating artefact, not a water-supply signal, is Lake Mohave's history. Here is its early-July fill for five straight years, next to San Carlos on the Gila:
| Reservoir |
Jul 2022 |
Jul 2023 |
Jul 2024 |
Jul 2025 |
Jul 2026 |
| Lake Mohave |
105% |
105% |
105% |
105% |
105% |
| San Carlos |
0% |
53% |
34% |
7% |
0% |
Mohave does not budge — it is held to a target. San Carlos swings wildly, from a wet-year 53% in 2023 back to empty in 2026, because it is a real storage reservoir on a drought-prone river. Averaging the two into a single state percentage buries exactly the information a reader wants.
The same test applied to the Salt River system, using SRP's own daily record, separates the one reservoir that stores water from the three that pass it along:
| Reservoir |
Jul 2024 |
Jul 2025 |
Jul 2026 |
| Roosevelt — storage |
90% |
57% |
39% |
| Apache — hydro |
93% |
93% |
92% |
| Canyon — hydro |
95% |
96% |
96% |
| Saguaro — hydro |
95% |
96% |
95% |
Three of the four barely move. Roosevelt has lost more than half its stored water in two years, and at 39% on 1 July 2026 it was near the lowest point in the three years of daily data SRP publishes. A visitor to Canyon or Saguaro this summer sees a full lake; the reservoir that decides whether Phoenix has a dry-year buffer is the one upstream, and it is draining.
Arizona's real water bank: Mead and Powell
For most of Arizona, the reservoir that matters is not inside the state at all. Arizona's cities and farms run substantially on Colorado River water delivered through the Central Arizona Project, and that water is stored in the two giant reservoirs on the state's borders: Lake Mead, behind Hoover Dam on the Arizona–Nevada line, and Lake Powell, behind Glen Canyon Dam on the Arizona–Utah line. We track them under Nevada and Utah, but they are Arizona's lifeline — and both are chronically low: Mead is around 26% and Powell around 22% of capacity. Those depleted reservoirs are why Arizona has been in a formally declared Colorado River shortage, taking mandatory cuts to its allocation. The state's Colorado River regulating reservoirs can read 100% while the storage that actually backs its supply reads a quarter full.
What reservoir levels do — and don't — tell you here
- What a reservoir is for changes what its level means. A regulating reservoir at 105% and a storage reservoir at 105% are not the same news: the first is being held there on purpose; the second would be a genuinely wet year. Arizona is the clearest case in the US where you cannot read the number without knowing the reservoir's job.
- Size decides whether a percentage matters. Canyon Lake at 96% and Roosevelt at 39% sit on the same river, Canyon two dams downstream of Roosevelt. Canyon holds 71 hm³; Roosevelt holds 2,012. A fill percentage without a capacity next to it is close to meaningless.
- Storage is a lagging signal, and a partial one. The Salt, Verde and Gila levels reflect the recent run of dry-to-mixed years over central Arizona; they do not forecast the summer monsoon, which is what actually decides whether Roosevelt, San Carlos and Horseshoe refill.
- Groundwater is the missing half. Much of Arizona's water, especially for agriculture and some cities, comes from aquifers that no reservoir gauge captures. Full or empty, these reservoirs describe only the surface-water slice of the state's supply.
What it means for the summer
The practical read for 2026: do not be reassured by Arizona's ~64% headline. The reservoirs holding it up are Colorado River regulators and small hydro lakes that would read near-full in a drought year too. The reservoirs that track Arizona's own conditions are low — Roosevelt down to 39% from 90% two years ago, San Carlos empty, the Verde storage reservoirs mixed — and the Colorado River bank the state ultimately depends on, Mead and Powell, remains near its long-term lows. Whether the in-state reservoirs recover this summer rests on the North American monsoon; whether the Colorado stabilises rests on the Rocky Mountain snowpack far upstream. Neither is something a July storage number can predict.
The honest summary: a state average propped up by reservoirs that are supposed to be full, sitting over a storage picture — Roosevelt at 39%, San Carlos at zero — that is much drier than 64% suggests.
This is a July 2026 snapshot of Arizona; for the national picture and where drought risk actually sits across the US, see the US reservoir levels edition and the neighbouring Texas reservoir levels, July 2026. How US water-data openness ranks is on the Reservoir Transparency Index.