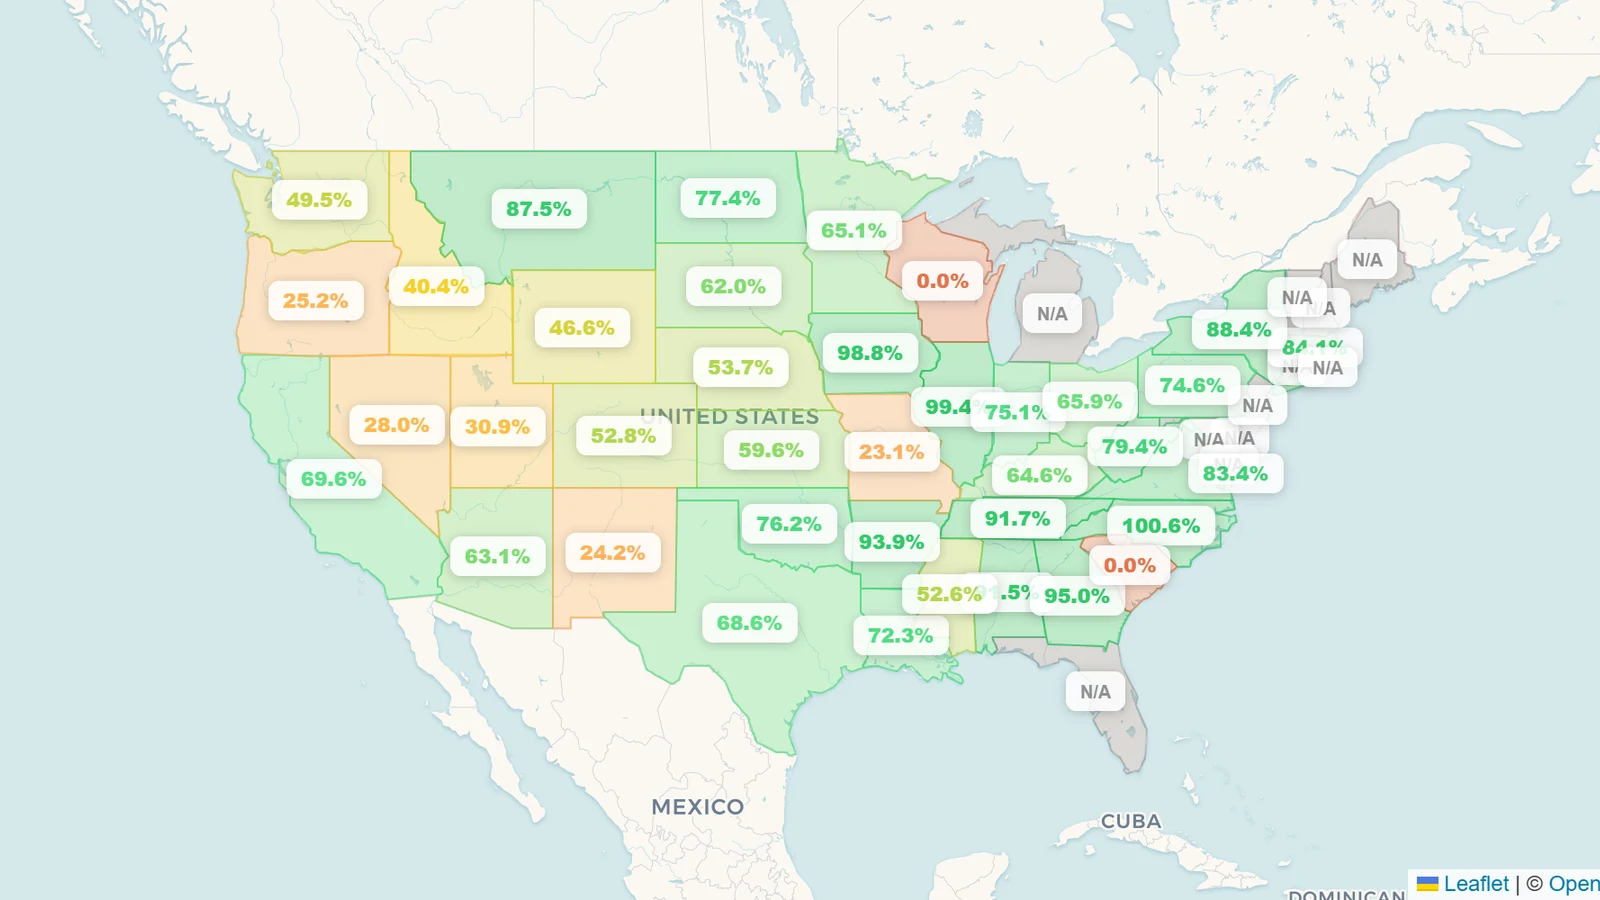
US reservoirs monitored by the federal agencies held about 55.3% of capacity on 4 August 2026 — roughly 144 km³ of water across 464 reservoirs in 38 states. Measured like-for-like, that is a fall: on a fixed basket of 290 reservoirs with a comparable reading every August since 2023, storage has gone 61.6% → 58.9% → 54.1% → 49.2% — three consecutive annual declines, and 12.4 points in three years. 211 of the 304 reservoirs we can compare with the same date in 2025 are lower than they were. The decline reaches the largest reservoirs in the country: Lake Powell is down 8.2 points on the year and Lake Mead 3.3, while the sharpest losses of all are upstream in the Colorado headwaters and the Snake River basin. Live figures are on the United States page.
Key takeaways
- The national figure is 55.3% full — about 144 km³ against 260 km³ of monitored capacity across 464 reservoirs in 38 states. Fifty-one reservoirs are critical and 78 are low.
- Like-for-like, storage has fallen three years running. On the 290 reservoirs with a comparable early-August reading every year since 2023: 61.6% → 58.9% → 54.1% → 49.2%. That is 24 km³ gone from the same basket in three years.
- The seasonal drawdown is normal; the trend is not. Across 442 reservoirs, storage fell 4.8 points during July — ordinary for an American summer. The multi-year slope is the signal.
- The sharpest declines are upstream, in the Colorado headwaters and the Snake basin. Blue Mesa is down 38 points year-on-year, Jackson Lake 33 and Lake Granby 33 — roughly seven times the 4.9-point national decline.
- Elephant Butte on the Rio Grande is at 1.3% — 33 hm³ in a reservoir built for 2,547 — the lowest reading in our record for it, and the reason New Mexico sits at 24.2%.
The decline is broad, not local
A single national percentage is a poor drought instrument: it moves with whichever reservoirs happen to be reporting. Comparing each reservoir with itself on the same date a year earlier is the harder test, and US storage fails it.
Of the 304 reservoirs with a reading within days of 4 August in both 2026 and 2025, 211 are lower and 84 higher. Widening that to four years, on the 290 reservoirs with a comparable early-August reading in all of them:
| Early August |
Fill (same 290 reservoirs) |
Stored |
| 2023 |
61.6% |
117.7 km³ |
| 2024 |
58.9% |
112.6 km³ |
| 2025 |
54.1% |
103.3 km³ |
| 2026 |
49.2% |
94.1 km³ |
Three consecutive declines, 12.4 points in total, and roughly 24 km³ of water — about two-thirds of Lake Mead's full capacity — gone from the same set of reservoirs since 2023. Each year has fallen further than the one before.
Within 2026 the month itself was unremarkable: on a fixed basket of 442 reservoirs, storage fell from 59.5% on 4 July to 54.7% on 4 August. Losing five points through July is what summer does. The four-year slope is what matters.
The two reservoirs that set the national number
Lake Mead (34.9 km³ of capacity) and Lake Powell (30.9 km³) together hold a quarter of all reservoir capacity the federal agencies monitor, so whatever they do dominates any national figure. Mead is at 24.9%, down 3.3 points on the year; Powell is at 21.5%, down 8.2.
Powell's fall is the one to watch. It is the larger year-on-year drop of the two, and it comes despite Colorado River shortage rules that cut deliveries precisely to slow this decline — the reservoir is losing water with the brakes already on. Because the pair is so large, the two states they are counted under, Nevada at 28.0% and Utah at 30.9%, are largely reporting Mead and Powell rather than their own weather.
Where the water actually disappeared
The largest year-on-year falls cluster in two places: the Colorado's Rocky Mountain headwaters, and the Snake and Owyhee systems of the interior Northwest.
This is a snowpack story rather than a heat story. These are high-elevation reservoirs that fill from melt between April and June; a thin or early-melting snowpack shows up in their August level and cannot be recovered until next winter. Idaho sits at 40.4% and Wyoming at 46.6%.
It is worth stating plainly what that ordering implies for the Colorado: Blue Mesa, on the Gunnison above Powell, fell nearly five times as far as Powell itself and eleven times as far as Mead. Water that never reached storage upstream is a deficit that arrives downstream later.
The lowest readings in the country
Among reservoirs holding more than 500 hm³, excluding flood-control structures that are kept empty by design:
Elephant Butte deserves its own line. New Mexico's largest reservoir and the backbone of Rio Grande irrigation is holding 33 hm³ against a capacity of 2,547 — 1.3%, and still falling day by day. New Mexico as a state reads 24.2%, the lowest in the country.
Where conditions are good
The picture is not uniformly bleak.
California, which dominated American drought coverage for a decade, is the third-largest monitored capacity in the country and sits at 69% — comfortably above the national figure, though its two biggest reservoirs are down 18 and 23 points on last year. Montana at 88% and Oklahoma at 76% are the healthiest large systems this August.
New this month: Arizona's Salt River system
Our Arizona coverage changed in August. The Salt River Project chain above Phoenix — Roosevelt, Apache, Canyon and Saguaro lakes — is now tracked with three years of daily history. It was previously missing because the federal feeds do not carry it: USGS publishes no storage series for the Salt River chain, and Reclamation's public records for Theodore Roosevelt Dam are sedimentation surveys rather than time series. SRP publishes the data itself, outside those APIs.
It matters for the numbers. Roosevelt Lake, at 2.0 km³, is by a wide margin the largest reservoir wholly inside Arizona, and it is at 37.8%, down from 51.7% a year ago — a 14-point fall that no federal feed was reporting. Adding the chain, and removing a duplicate record of Lake Mohave that had been counted twice, moved Arizona's figure from 84% to 63.4%. A state percentage is only ever as good as the list of reservoirs behind it.
How we calculate this
Every figure here is capacity-weighted: water stored divided by the capacity of the reservoirs actually reporting, not an average of percentages. Reservoirs whose latest reading is more than 45 days old are excluded rather than carried forward.
Comparisons across years use a fixed basket — only reservoirs with a reading near both dates — because our monitored set changes as sources are added and as feeds drop out. That is why the national headline (55.3%, 464 reservoirs) and the four-year series (49.2%, 290 reservoirs) differ: the first is everything reporting today, the second is the subset with four Augusts of record. Comparing those two numbers to each other would be meaningless; comparing each to its own history is the point.
The reservoir count also fell this month for a second reason, and it is our own correction rather than a source change. USGS, Reclamation and USACE each publish some of the same dams under their own station ids, so 22 reservoirs were arriving in our dataset twice — Reclamation projects such as Lake Meredith, Fort Cobb and Tom Steed that USACE or USGS also report, and Lake Altus, which arrived three times. Each duplicate was counted twice in every total. Removing them cut Oklahoma's monitored capacity from 19.8 km³ to 16.2 km³ and raised Texas from 66% to 69%, because a duplicate does not just inflate capacity — it distorts the weighting of everything around it.
Coverage genuinely moves. Between the 3 and 4 August refreshes, the USACE feed stopped returning a group of reservoirs including Oahe, the third-largest in our US set. South Dakota still reports, but on five Reclamation reservoirs rather than the Missouri mainstem dams, so its monitored capacity fell from 32.5 km³ to 0.6 km³ and it no longer appears among the largest systems. We report what the sources publish on the day and say so, rather than carrying stale values forward to keep a tidy list.
Sources are USGS NWIS, the Bureau of Reclamation's RISE, USACE CWMS, California's CDEC and, from this month, SRP for the Salt River chain. Capacities come from the National Inventory of Dams where a confident match exists. Federal coverage is concentrated in the 17 western Reclamation states; many eastern and state-managed reservoirs have no public machine-readable storage feed and are simply absent.
This is a 4 August 2026 snapshot. The previous edition is US reservoir levels, June 2026; how US water-data openness ranks is on the Reservoir Transparency Index; and how we obtain and check these figures is in how we get our data: the United States.