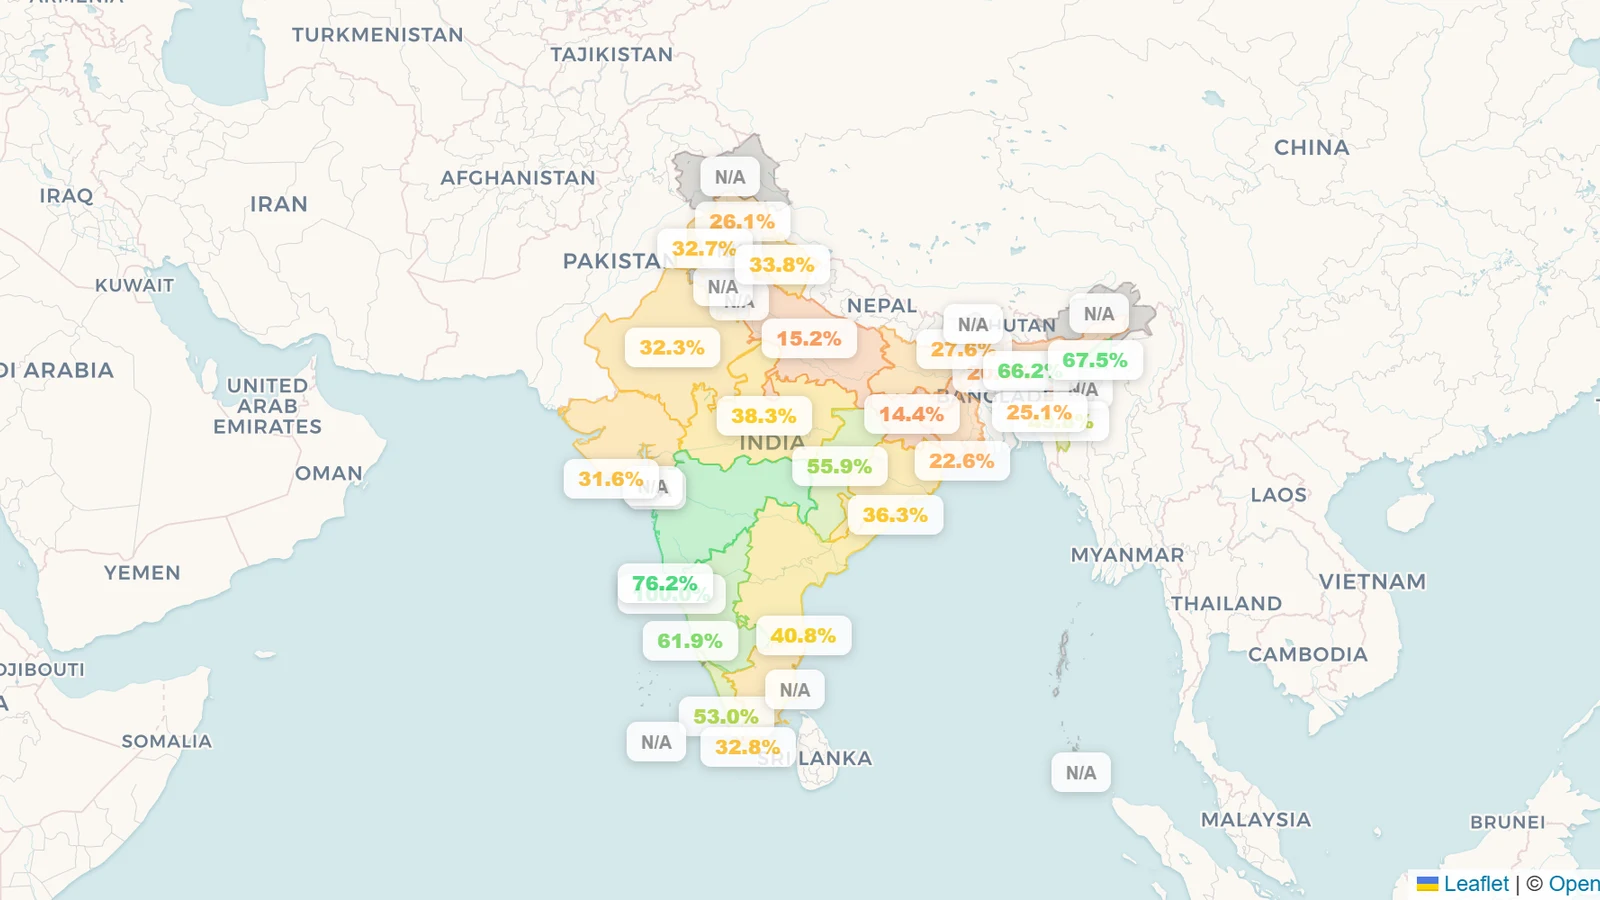
India's monitored reservoirs held about 41% of capacity on 4 August 2026 — roughly 97 km³ of water across 313 reservoirs — on Central Water Commission and state-portal readings dated 30 July to 4 August. The monsoon has done its job on the calendar: storage was at 22% four weeks earlier, so the dams have refilled faster in July than in any month of the year. It has not done its job against the record. Compared like-for-like with the same reservoirs on the same date in 2025, national storage is 20 points lower, and the shortfall is not spread evenly — it sits almost entirely in central India, the Krishna and Cauvery basins, and eastern Rajasthan. Live figures are on the India page.
Key takeaways
- India's reservoirs are 41.3% full as of 4 August 2026 — about 97 km³ stored against 236 km³ of monitored capacity across 313 reservoirs in 24 states.
- The monsoon refill is real: +15.4 points in four weeks. On a fixed basket of 135 reservoirs, storage went from 22.3% on 4 July to 37.7% on 4 August. Of the reservoirs with a fresh reading, 79 were rising week-on-week and only 18 falling.
- But it is 20 points behind last year. The same 133 reservoirs read 37.7% now against 57.7% on 4 August 2025. Against 2024 the deficit is smaller but still clear: 39.4% now versus 44.6% then, on the reservoirs with three years of record.
- The deficit is regional, not national. Madhya Pradesh sits at 38%, Uttar Pradesh at 15% and Jharkhand at 14%, while Maharashtra is at 76% and Karnataka at 62%.
- Southern India lost the most ground. Lower Bhawani is at 21% against 100% a year ago, and Krishnaraja Sagara at 22% against 90% — the sharpest year-on-year reversals in the dataset.
The monsoon flipped the reservoirs — on schedule
July is the month India's reservoirs are supposed to turn, and in 2026 they turned. Our July status piece put national storage at the annual floor, around 22–24%, and noted that the trajectory rather than the level would be the signal. The trajectory arrived.
On a fixed basket of 135 reservoirs — the ones with a comparable reading on both dates, together holding 181 km³ of capacity — storage rose from 22.3% on 4 July to 37.7% on 4 August. That is roughly 28 km³ of water added in four weeks, and it is the steepest four-week gain in our Indian record.
The week-by-week trend confirms it rather than resting on two snapshots. Of the 304 reservoirs reporting a fresh reading, 79 were rising and 18 falling against their previous bulletin. Individual gains were large: Rengali in Odisha added 35 points in a single week, Hirakud 15 points, Bargi 11 and Pong 8.
Against last year, the picture inverts
A rising number is not the same as a healthy one, and this is where the August reading turns uncomfortable. Comparing each reservoir with its own level on the same date in 2025 — 133 reservoirs, 178 km³ of capacity, all with a reading within days of 4 August in both years — national storage is 37.7% now against 57.7% then.
That is a 20-point deficit, and 93 of those 133 reservoirs are lower than they were a year ago, against only 35 higher.
Widening to three years, using the 103 reservoirs with a record that long:
| Date |
Fill (same 103 reservoirs) |
Stored |
| 4 August 2024 |
44.6% |
60.9 km³ |
| 4 August 2025 |
60.0% |
82.0 km³ |
| 4 August 2026 |
39.4% |
53.8 km³ |
2026 is the lowest of the three, and below even 2024. The 2025 monsoon was exceptionally strong across the south and centre; 2026 is not repeating it.
Where the deficit sits
The national average hides two different monsoons. These are the largest year-on-year falls among reservoirs holding more than 500 hm³:
Two things stand out. First, Indira Sagar is India's largest monitored reservoir at 12.2 km³ — a 56-point fall there moves the national number on its own. Second, four of the ten are in Karnataka, whose state-level fill still reads a comfortable 62%. That figure is carried by Almatti at 90% and the Krishna-basin dams; the Cauvery and Malaprabha systems behind it are in a materially worse position than the state average suggests.
Where the monsoon delivered
The gains are concentrated in Maharashtra, Odisha and the Northeast:
Maharashtra is the standout: at 76% capacity-weighted fill across 35 reservoirs, it is the best-supplied large state in the country this August, and the inverse of its position in several recent years.
The state picture
Capacity-weighted fill, computed live from the reservoirs in each state with a current reading:
Madhya Pradesh matters most in absolute terms: it holds the largest monitored capacity in the country, 35 km³, and at 38% it is storing roughly 13 km³ against a possible 35.
What "% full" means here
Every figure above is capacity-weighted, not an average of percentages: we sum the water stored and divide by the capacity of the reservoirs actually reporting. A simple mean would let a 20 hm³ tank count the same as Indira Sagar at 12.2 km³.
Comparisons over time use a fixed basket — only reservoirs with a reading near both dates — because India's monitored set changes as state portals come and go. Mixing baskets is the easiest way to overstate a trend: the headline 41.3% covers all 304 reservoirs reporting today, while the fixed basket with a full year of record reads 37.7%. Neither is wrong, but only the second can be compared with last year — and quoting the first against the second would invent 3.6 points of recovery that never happened.
The underlying data is the Central Water Commission's weekly reservoir bulletin, supplemented by state water portals. Percentages are against each reservoir's full reservoir level as reported by the source, so "100%" means full to FRL, not overtopping.
What to watch through September
India's reservoirs normally peak in late September, after the monsoon's second half. That leaves roughly eight weeks for the deficit to close, and the arithmetic is demanding: returning to last year's end-of-July position alone would require about 30 km³ across the monitored set.
Three things decide it. Central India — Madhya Pradesh and Uttar Pradesh, together 47 km³ of capacity at 38% and 15% — carries the largest absolute gap. The Cauvery basin determines whether Tamil Nadu and southern Karnataka enter the dry season with a usable buffer or without one. And the reservoirs already near full in Maharashtra and Odisha shift from a storage question to a flood-management one.
The honest summary: a monsoon that arrived on time and is filling reservoirs quickly, but from a low base and into a record that is still 17 points short of last year.
This is an August 2026 snapshot. The previous edition is India reservoir levels, July 2026; how India's water-data openness ranks is on the Reservoir Transparency Index; and how we obtain and check these figures is in how we get our data: India.