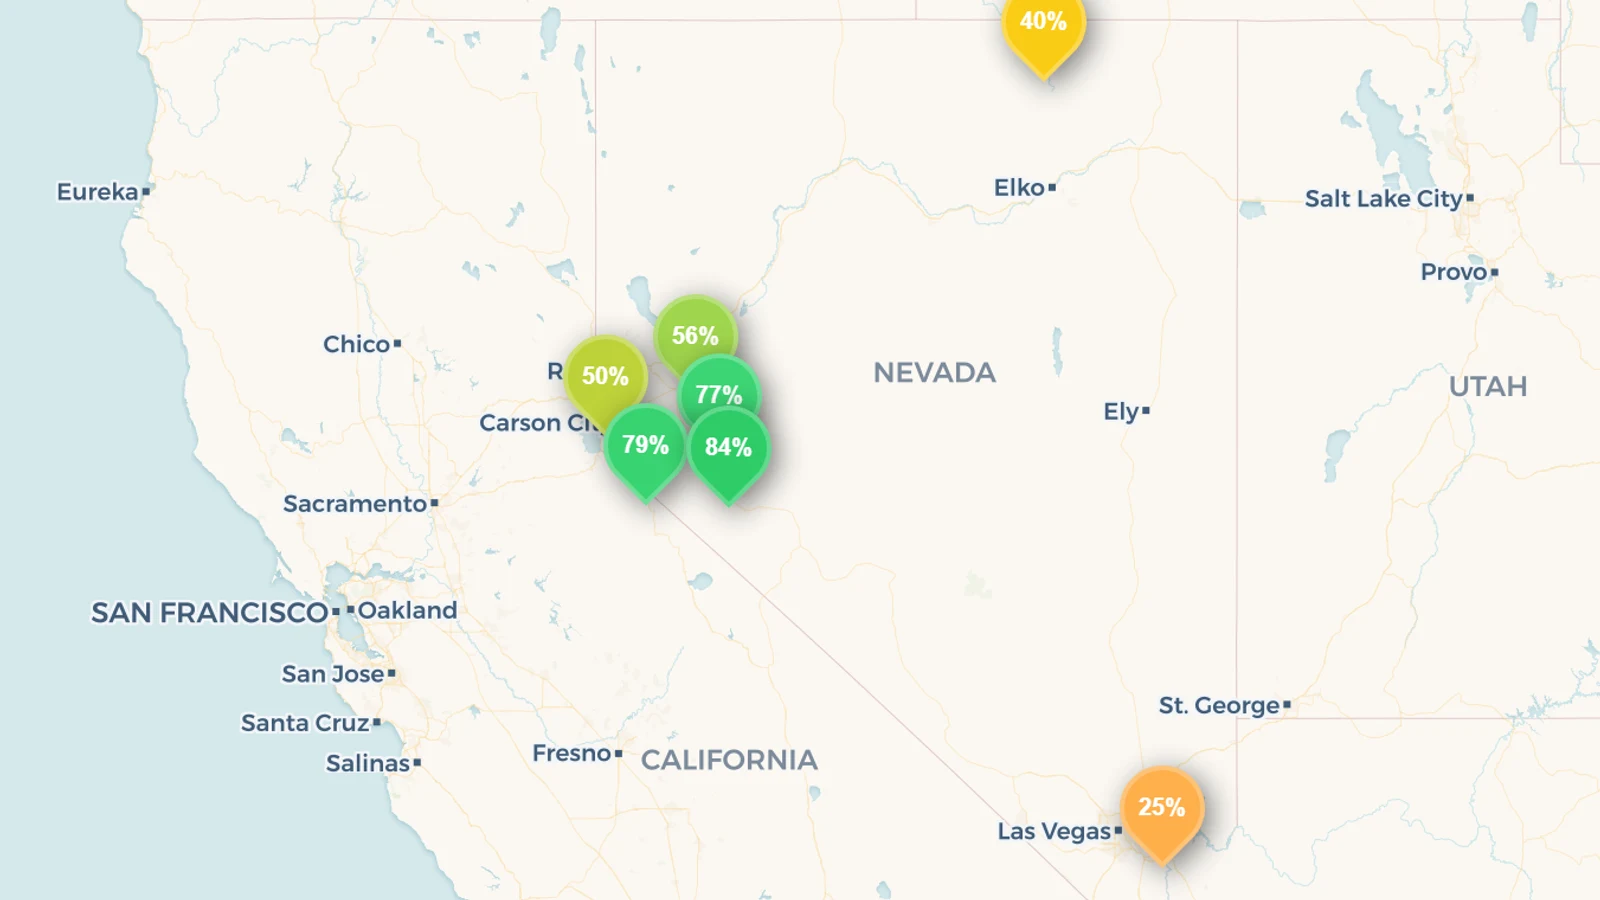
Nevada's tracked reservoirs read about 29% full in mid-July 2026 — a number that puts the state near the bottom of everything we track, second only to New Mexico. But almost the entire figure is a single reservoir: Lake Mead, the Colorado River giant behind Hoover Dam, which holds about 94% of all the reservoir capacity we track in Nevada and sits at just 25.4% as of 11 July — a hair below its own already-low July norm and effectively tied with 2022 for its lowest early-July reading in five years. Take Mead out and the rest of Nevada — the snow-fed lakes and irrigation reservoirs of the western Sierra and the Great Basin — averages about 77%. That sounds healthier, and it is, until you read the second signal underneath it: five of the seven Nevada reservoirs we track are below their normal level for mid-July, and one, Wild Horse in the state's northeast corner, has fallen from 88% to 40% in a single year. Live figures are on the Nevada page; the national picture is on the United States page.
Key takeaways
- The ~29% statewide headline is really Lake Mead. Mead is about 25.4% full (11 July 2026) and holds roughly 94% of Nevada's tracked reservoir capacity, so it sets the state number almost single-handedly. Strip it out and the rest of Nevada averages about 77%. Live figures are on the Nevada page.
- Mead is near a five-year July low. Its early-July fill has gone 25.4% → 28.9% → 30.5% → 28.5% → 25.4% over 2022–2026 — level with 2022 for the lowest of the five, and about 3 points under even its own low July norm.
- The rest of the state is mostly below normal too. Five of the seven Nevada reservoirs we track sit under their mid-July average — Walker Lake (84% vs ~91%), Lahontan (56% vs ~66%), Marlette (50% vs ~85%) — a below-average year, not just a Mead problem.
- Wild Horse is the sharpest fall. Wild Horse Reservoir, on an Owyhee tributary near the Idaho line, has dropped from ~88% in July 2025 to ~40% now, one of the steepest one-year swings of any reservoir we track.
- Same water, two state numbers. The Colorado River supply Nevada and Arizona both live on is Lake Mead — but Mead sits in Nevada's column in our data, which is a big reason Nevada reads ~29% while Arizona reads ~84%.
Where the data comes from
There is no single national US reservoir bulletin, so Nevada is assembled from federal gauges. The one that matters most — Lake Mead behind Hoover Dam — comes from the US Bureau of Reclamation, which operates the Colorado River storage system. The rest of the state's reservoirs and lakes — Lahontan, Walker Lake, Wild Horse, Topaz, Marlette and Weber — are read from US Geological Survey (USGS) gauges. reservoirs.earth mirrors those gauges, adds multi-year history and rolls them up by state. Every figure below is dated, because reservoir levels change daily; the live numbers and each reservoir's chart are on the Nevada page and on each reservoir's own page.
Why one reservoir writes the whole headline
The single most important fact about Nevada's reservoir number is arithmetic, not weather: Lake Mead is so much larger than everything else that it effectively is the state average. Mead's capacity is roughly 34.9 km³; every other Nevada reservoir we track, added together, comes to about 2.3 km³. When one reservoir is fifteen times the size of all the others combined, a capacity-weighted state fill is mostly just that reservoir's fill wearing a state's name.
That is why the ~29% figure and the ~77% "rest of Nevada" figure are both true and describe different things. Mead is the largest reservoir in the United States by capacity and the Colorado River's lower bank account, shared by seven states and Mexico; its level reflects two decades of over-allocation and drought across the whole basin — not the snow that fell on the Sierra this winter. The reservoirs that do reflect Nevada's own year are the small ones, and to read them you have to set Mead aside.
The Lake Mead paradox: Nevada's number, everyone's water
Here is the quirk that makes Nevada look so much drier than its neighbour. Lake Mead straddles the Nevada–Arizona border, and its water is drawn by Nevada, Arizona, California and Mexico alike. In our data it is filed under Nevada — so Nevada's statewide fill is dragged down to ~29% by a reservoir at 25%, while Arizona, which depends on the very same water, reads ~84% because its own tracked reservoirs are the near-full regulating pools of the lower Colorado and Salt River, with Mead counted next door.
Neither number is wrong; they are answering different questions. Arizona's ~84% describes the reservoirs physically inside Arizona. Nevada's ~29% is really a reading on the Colorado River itself. If you want to know how the West's largest reservoir is doing, Nevada's headline is the honest place to look — and at 25.4%, three points below even its depressed July norm, the answer is: still near the floor.
The current picture (as of mid-July 2026)
Sorted by size, here is the state — the one giant, then the reservoirs that actually track Nevada's own snow and rivers.
The Colorado River giant:
| Reservoir |
River / role |
Fill |
Normal (mid-Jul) |
| Lake Mead |
Colorado — major storage |
25.4% |
~28.5% |
The Great Basin and Sierra reservoirs that follow Nevada's own year:
| Reservoir |
River / area |
Fill |
Normal (mid-Jul) |
| Walker Lake |
Walker River terminal lake |
84.2% |
~90.7% |
| Topaz Lake |
West Walker (off-stream) |
78.6% |
~73.9% |
| Weber Reservoir |
Walker River |
77.0% |
~62.2% |
| Lahontan |
Carson / Newlands Project |
55.5% |
~66.1% |
| Marlette Lake |
Sierra / Carson City supply |
50.2% |
~84.8% |
| Wild Horse |
Owyhee tributary (Elko Co.) |
39.9% |
~78.8% |
Read the third and fourth columns together and the pattern is clear. Two small reservoirs on the Walker system — Topaz and Weber — are running above their July norm, but they are the smallest in the set. The larger and more representative reservoirs are all below: Lahontan, which stores Carson River water for the farms around Fallon, is ~10 points light; Marlette is ~35 points light; and Wild Horse, up near the Idaho border, is a remarkable ~39 points below where mid-July usually finds it. These are not empty reservoirs, but most came out of winter carrying less than they normally do — the fingerprint of a thin snowpack rather than a single hot spell.
Lake Mead's five-year July slide — and Wild Horse's one-year drop
The clearest way to see why Mead is the headline is its early-July fill over five straight years, set against a small northern Nevada reservoir that rose and fell much faster with the winters:
| Reservoir |
Jul 2022 |
Jul 2023 |
Jul 2024 |
Jul 2025 |
Jul 2026 |
| Lake Mead |
25.4% |
28.9% |
30.5% |
28.5% |
25.4% |
| Wild Horse |
49.8% |
99.9% |
97.9% |
87.9% |
42.7% |
The two lines make the same point at different speeds. Mead barely moves — it is so vast that even the wet winters of 2023–24 only nudged it into the low 30s, and in 2026 it has slid back to its 2022 mark. Wild Horse, a fraction of the size, swings the full range: near-empty in the 2022 drought, brim-full after the big 2023 snow year, and now collapsed back to ~43% (early July) after a poor winter on the Owyhee headwaters. One reservoir writes Nevada's headline; the other tells you what kind of winter the north actually had.
What reservoir levels do — and don't — tell you here
- A state average can be one reservoir in disguise. When a single reservoir holds almost all the capacity, as Mead does in Nevada, the "statewide" number stops describing the state and starts describing that reservoir — and in Mead's case, the whole Colorado River. The useful figures are Mead on its own and the rest of Nevada on its own, never the blend.
- Below-normal is the signal, not empty. Most of Nevada's smaller reservoirs are still half-full or better. The news is not that they are dry; it is that most are a step or two below their July norm after a weak snow year.
- Terminal lakes aren't ordinary reservoirs. Walker Lake is a natural desert lake with no outlet, gauged like a reservoir here; its long, slow decline is driven by upstream diversion on the Walker River as much as by any one season.
- Storage looks backward, snowpack looks forward. These reservoirs record the winter that just ended. Whether they refill depends on next winter's snow across the Sierra and the Upper Colorado — something no July storage figure can forecast.
What it means for the summer
The practical read for 2026: Nevada is not out of water, but the number that dominates its supply — Lake Mead — is back down near its five-year low, and most of the state's smaller reservoirs are running below normal on top of it. For Las Vegas and the Lower Colorado, Mead at 25% is the figure that matters, and it is a basin-wide problem that no amount of Nevada snow alone can fix; the levers are upstream, at Lake Powell and across the seven-state compact. For the ranching and farming north — the Humboldt, the Owyhee, the Walker and Carson — the more relevant reservoirs are the small ones close to home, and this year most of them are telling the same quiet story: a little less water than usual, going into a summer that will ask for a lot.
The honest summary: a ~29% state figure that is really the largest reservoir in America sitting near its floor, over a scattering of Great Basin reservoirs that are not empty, but are mostly below where mid-July usually finds them.
This is a July 2026 snapshot of Nevada; for the national picture and where drought risk actually sits across the US, see the US reservoir levels edition and the neighbouring Arizona, Utah and New Mexico editions. How US water-data openness ranks is on the Reservoir Transparency Index.