Where these numbers come from
South Africa's national source is the Department of Water and Sanitation (DWS), which publishes a Weekly State of the Reservoirs bulletin covering about 218 dams that between them hold more than 90% of national storage. The bulletin dated 3 August 2026 carries three columns for every dam — this week, last week, and the same week a year ago — which is what makes the year-on-year comparisons in this article possible without any modelling. reservoirs.earth mirrors that bulletin and keeps each dam's history; for how the national figure is assembled from nine provinces, see our South Africa dam levels explainer.
One figure needs a footnote. DWS quotes a national total of 95.5%, against 96.5% the same week last year. Our 95.9% covers the same dams minus the shared storages in Lesotho (Katse, Mohale) and Eswatini (Maguga), which sit outside South Africa's borders and outside our provincial rollups. Those three dams hold about 2.7 km³ of the bulletin's 32.0 km³ and are collectively fuller than average, which is the whole of the difference.
The national number is stable. Four provinces are not.
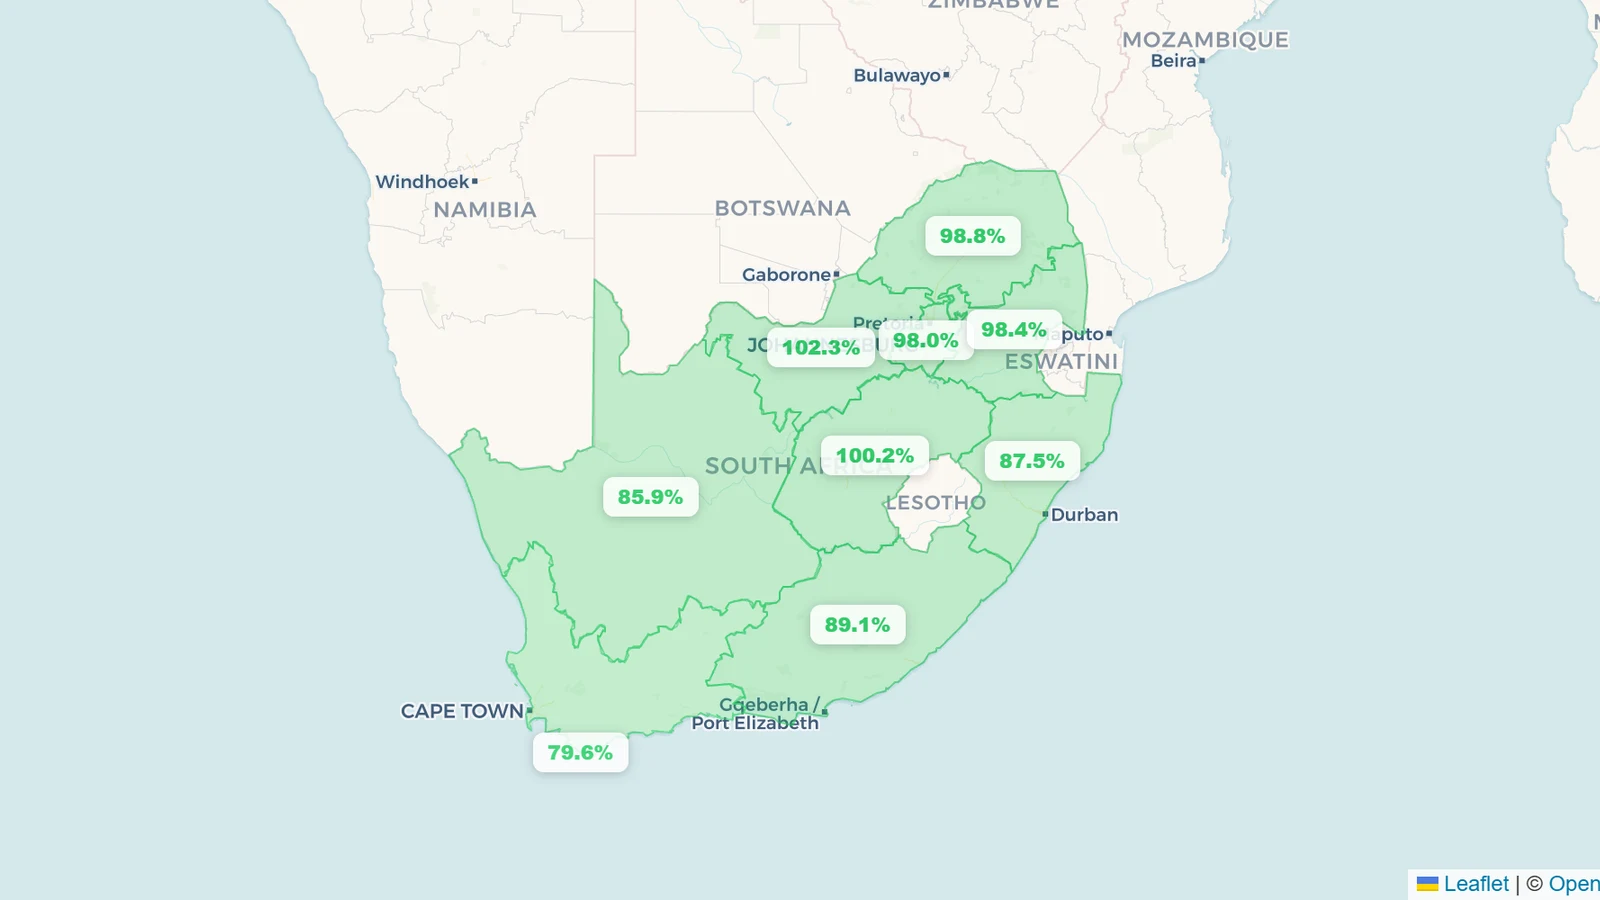
National storage moved by a single point year-on-year. Underneath it, four provinces moved by nine points or more:
Source: DWS Weekly State of the Reservoirs, 3 August 2026. Provincial percentages are capacity-weighted. The figures on our province pages match these to within 0.2 points; the small gap is two dams that have stopped reporting and are excluded from our live rollup.
Early August is the deep dry season for most of South Africa, which is a summer-rainfall country: the interior and the eastern provinces refill between October and March, then draw down gently until the next rains. So the interior provinces sitting at or above 100% in August are not still filling — they banked that water in autumn and have barely spent it. The week-over-week column shows the pace: two or three tenths of a percent, province after province.
Cape Town's winter is behind schedule
The Western Cape runs on the opposite calendar — cold-front rain between roughly May and September — so August should be its strongest month of refill. The provincial total of 79.6% masks a split that DWS reports separately and that matters a great deal:
- The winter-rainfall zone, which includes Cape Town's dams, was 76.4% full — down from 79.8% the same week last year, and up only 0.1 points on the week.
- The other-rainfall zone of the Western Cape was 98.8%, against 70.7% a year ago.
In other words, the province looks marginally better than last August only because its non-Cape half surged. The half that supplies the metro is behind. The Cape Town supply system was 77.9% full on 3 August 2026, against 84.5% the same week in 2025 — a gap of six and a half points, with the winter rains typically running only into September.
The individual dams tell the same story. Theewaterskloof, the largest storage in the city's system, was 77.9% and falling slightly on the week, against 79.4% a year ago. Voelvlei was 61.8%, against 85.4% last August — a drop of more than 23 points. Berg River was 89.7% and gaining, but a year ago it was full. Steenbras-Lower, at 52.3% against 76.9%, is part of the city's pumped-storage scheme and moves with operations as much as with rainfall. Only Wemmershoek, at 99.3%, is comfortably ahead of its 2025 position.
This is not a Day Zero. The system is better than three-quarters full and the season is not over. But Cape Town's dams have entered August lower than they were a year ago, and the direction of travel through late August and September is the number worth watching. We tracked the same system through July in Cape Town Dam Levels, July 2026.
Limpopo went from nearly empty to full
The largest single move on the map is in Limpopo, which rose from 86.7% to 98.8% year-on-year on the back of a strong summer season in the far north.
The individual recoveries are extraordinary. Middel-Letaba, a 172 hm³ dam in the Mopani district, was 6.5% full on 3 August 2025 and 99.0% on 3 August 2026. Modjadji went from 33.4% to 100.7%. Nsami climbed from 75.3% to 91.1%. Across the Mopani district municipality as a whole, storage went from 53.9% to 94.1% in twelve months.
One dam bucks the trend, and it is the one that matters most locally: Tzaneen, the main supply for the Letaba valley, was 82.2%, slightly below the 85.4% it held a year ago, and it has drifted down every week of the past fortnight.
KwaZulu-Natal is the province losing ground
KwaZulu-Natal fell from 96.6% to 87.5% year-on-year — the second-largest decline on the map and the one with the most people behind it.
Pongolapoort, the province's largest dam at 2,395 hm³, was 83.8% against 95.7% a year ago. Ntshingwayo, which supplies the Newcastle area, was 68.9%, down from 93.3%. The Umgeni system that supplies Durban and Pietermaritzburg was 90.7%, against 97.9% last year, with Midmar at 89.5%, Albert Falls at 89.2% and Spring Grove at 82.6%. Hazelmere, north of Durban, was 85.7% against 102.0% a year ago.
None of these is at a crisis level, and KwaZulu-Natal's next refill window opens with the summer rains in October. But the province entered the dry season roughly nine points lighter than last year, and it will spend the next two months drawing down from that lower start.
Nelson Mandela Bay is full again
The clearest good-news story is in the Eastern Cape, which rose from 82.0% to 89.2%.
The Algoa water supply system, which serves Gqeberha (Port Elizabeth) — a metro that came within weeks of running dry in 2022 — was 100.2% full on 3 August 2026, against 67.9% the same week last year. Impofu doubled from 50.4% to 100.4%. Kouga went from 76.9% to 100.4%. Kromrivier rose from 77.9% to 100.7%.
Further east, the Amathole system supplying Buffalo City recovered sharply in a single week, from 90.7% to 95.2%, with Nahoon jumping from 73.4% to 86.7% in seven days. The province's laggard remains Darlington on the Sundays River, at 48.3% — better than the 39.8% of a year ago, but still the lowest large dam in the province.
The two lowest dams, and why they are low
Only two of the 216 reporting dams were below 40% full, and neither is a drought signal on its own:
- Klipheuwel (Western Cape, 4.5 hm³) at 22.9%, down from 24.8% on the week and 25.2% a year ago. It is a small dam that has been low for at least a year.
- Boegoeberg (Northern Cape, 23.6 hm³) at 29.5%, against 105.3% a year ago. Boegoeberg is a balancing dam on the Orange River — a distribution point whose level swings with operations rather than rainfall, and DWS flags its current reading as the latest available rather than a fresh survey. Its drop is most of the reason the Northern Cape's provincial number fell nine points.
Why some dams read above 100%
Several dams in the table above are over 100% full, and Bloemhof sits at 106.4%. That is not an error. DWS measures against nett full supply capacity — the volume at the full supply level, below the spillway. After good rains a dam can legitimately hold water above that line, in the surcharge zone, until it spills or is drawn down. A reading of 106% means the dam is full and then some, not that the gauge is broken.
A note on the data
In July we reported that DWS had stopped publishing its weekly bulletin, leaving South Africa — a country that normally scores well on the Reservoir Transparency Index — temporarily unreadable from outside its borders. The bulletin is publishing again, and the 3 August edition restored two full weeks of readings for all 216 dams at once.
We are flagging one gap rather than papering over it: our national series holds readings for 6 July and then nothing until 27 July. Those two missing weeks are not interpolated and never will be — if the intervening bulletins become available, we will backfill them and say so. Every figure in this article is dated for that reason.