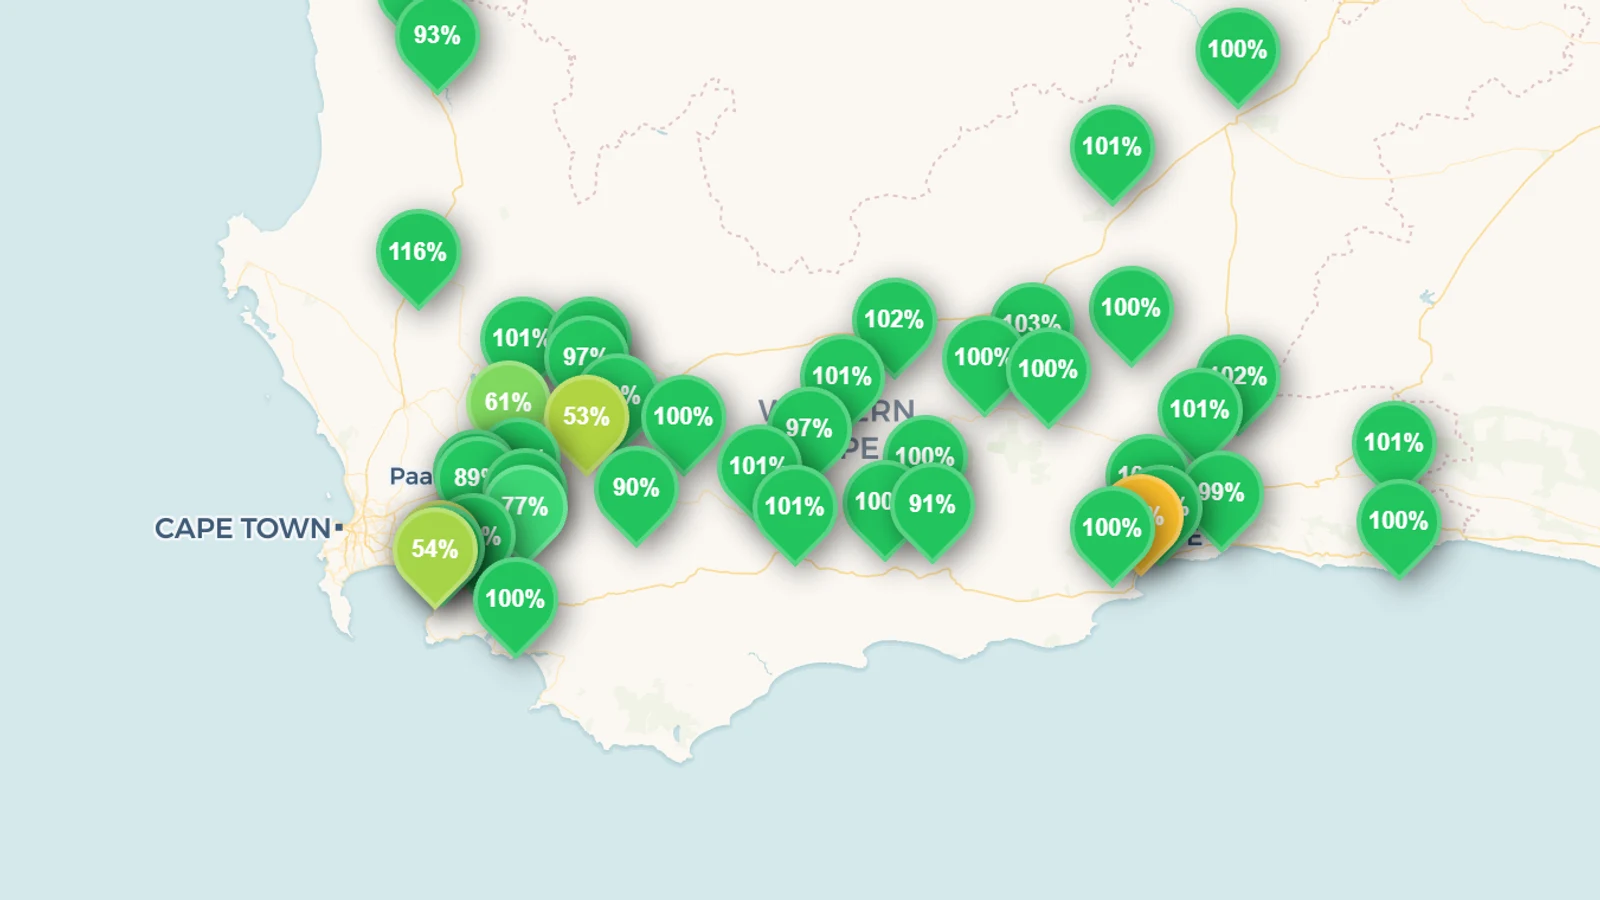
As of the City of Cape Town's Weekly Water Dashboard for 6 July 2026, the Western Cape Water Supply System (WCWSS) — the six big dams that supply Cape Town — was 77.3% full, up 2.4 percentage points in a single week and still climbing through the winter wet season. That figure sits behind roughly 694 million cubic metres of stored water against about 898 million m³ of system capacity. It is a different world from the "Day Zero" winter of 2018, when these same dams ran down toward 20% and the city drew up plans to switch off most household taps. The live level of every Cape dam is on the South Africa dam levels page; this piece reads the Cape's supply system as it stands today, dam by dam.
Key takeaways
- The WCWSS was 77.3% full on 6 July 2026 — up 2.4 points on the week and rising, because the Western Cape gets its rain in winter and July is the middle of the filling season. The Western Cape is the lowest-filled region in South Africa precisely because it is mid-refill, not in drought.
- Theewaterskloof, the largest dam in the system, holds just over half of all WCWSS storage on its own and was at 77.3% and climbing.
- Berg River jumped to 89.0% in the week (from 85.5%), and Wemmershoek (99.9%) and Upper Steenbras (98.6%) are effectively full.
- The two lowest are Voëlvlei (60.8%) and Lower Steenbras (54.2%) — and Lower Steenbras swings with the City's pumped-storage electricity operations, not just with rainfall.
- The City calls May 2026's rain an anomalous event that recovered about 20% of system storage in one week, and it now sees the WCWSS as likely to reach full supply capacity by November 2026.
The Big Six, dam by dam (6 July 2026)
Cape Town runs on six major dams. Ranked by size, this is how full each was in the City's 6 July 2026 dashboard, against the week before and against the same point a year earlier:
Two things stand out. First, Theewaterskloof dominates — at 480,188 megalitres it is more than half of the whole system, so the combined figure tracks it closely. Second, every dam gained ground on the week except Wemmershoek, which is simply already full. The system is doing exactly what a winter-rainfall catchment should be doing in July: filling.
Where these numbers come from — and why they lead the national bulletin
Most of the reservoir figures on this site come from the national Department of Water and Sanitation (DWS) Weekly State of Reservoirs bulletin, which reservoirs.earth mirrors for all ~217 South African dams and scores on the Reservoir Transparency Index. The dam-by-dam numbers above come from a second, independent source: the City of Cape Town's own Weekly Water Dashboard, published every week for the WCWSS supply dams.
The City is not re-publishing DWS's data — it is a measurer in its own right. Its dam-levels page states plainly that "the City of Cape Town and the National Department of Water and Sanitation measures dam levels." Because the City runs its own weekly pipeline, its figures are dated 6 July 2026, a week ahead of the most recent public national bulletin. When a Cape dam's level here differs from its live figure on the South Africa page, that is why: this article cites the City's newer weekly reading, and each dam's own page carries the national series and full multi-year history.
Who actually owns Cape Town's dams
The "big six" are not all national dams. Ownership splits evenly, three and three:
| Owner / operator |
Dams |
| National DWS |
Theewaterskloof, Voëlvlei, Berg River (the three largest) |
| City of Cape Town |
Wemmershoek, Upper Steenbras, Lower Steenbras |
The City owns and operates the two Steenbras dams — which double as the upper and lower reservoirs of its 180 MW Steenbras pumped-storage electricity scheme — and Wemmershoek, its oldest supply dam. That is why Lower Steenbras can sit relatively low (54.2%) while its neighbours fill: its level is drawn down and pumped back up to generate and store power, so it moves with grid operations as much as with rain. The three largest dams are national assets. Regardless of who owns the concrete, DWS remains the national custodian that allocates the raw water in all six under the National Water Act — but the day-to-day measuring and publishing is something the City does for itself, which is what keeps its dashboard current.
From Day Zero to a system that is filling
Cape Town is the city that came closest to running dry. Through the 2015–2018 drought the WCWSS fell toward 20%, the City imposed Level 6B restrictions capping residents at 50 litres per person per day, and "Day Zero" — the date the municipal taps would be switched off — became a global news story before late rains and deep demand cuts pushed it off the calendar.
Eight years on, the picture is almost inverted. The City's dashboard describes exceptional rainfall in May 2026 — an "anomalous event," with extreme intensities in several catchments — that recovered about 20% of system storage in a single week and lifted the odds of the dams reaching full supply by November. Restrictions are not in force; the City's stated water-resource status is simply "water wise use." Households are using about 146 litres per person per day, against a rolling twelve-month average near 160 — a fraction of pre-drought consumption, and a habit that outlasted the crisis.
What "% full" means for the Cape
Reading Cape Town's dams well means remembering two things:
- This is a winter-rainfall system, so July is a fill month. Unlike the summer-rainfall interior — the Free State, Gauteng and Limpopo dams that peaked in autumn and are now easing down — Cape Town's dams are refilled by cold fronts between roughly May and September. A rising number now is normal; the level to watch is the spring peak.
- Not every low number is rainfall. Lower Steenbras at 54.2% is an operating reservoir for a power scheme, not a dam waiting on rain. Read each dam against the same week in earlier years on its own page before calling a level high or low.
For the country-wide context — where a 96%-full national figure hides the Western Cape running on its own clock — see our July 2026 South Africa status and the South Africa dam levels explainer.
Cape Town's dams are tracked between updates on the South Africa dam levels page and the Western Cape provincial breakdown. For the national view, see the July 2026 South Africa status and the South Africa dam levels explainer.