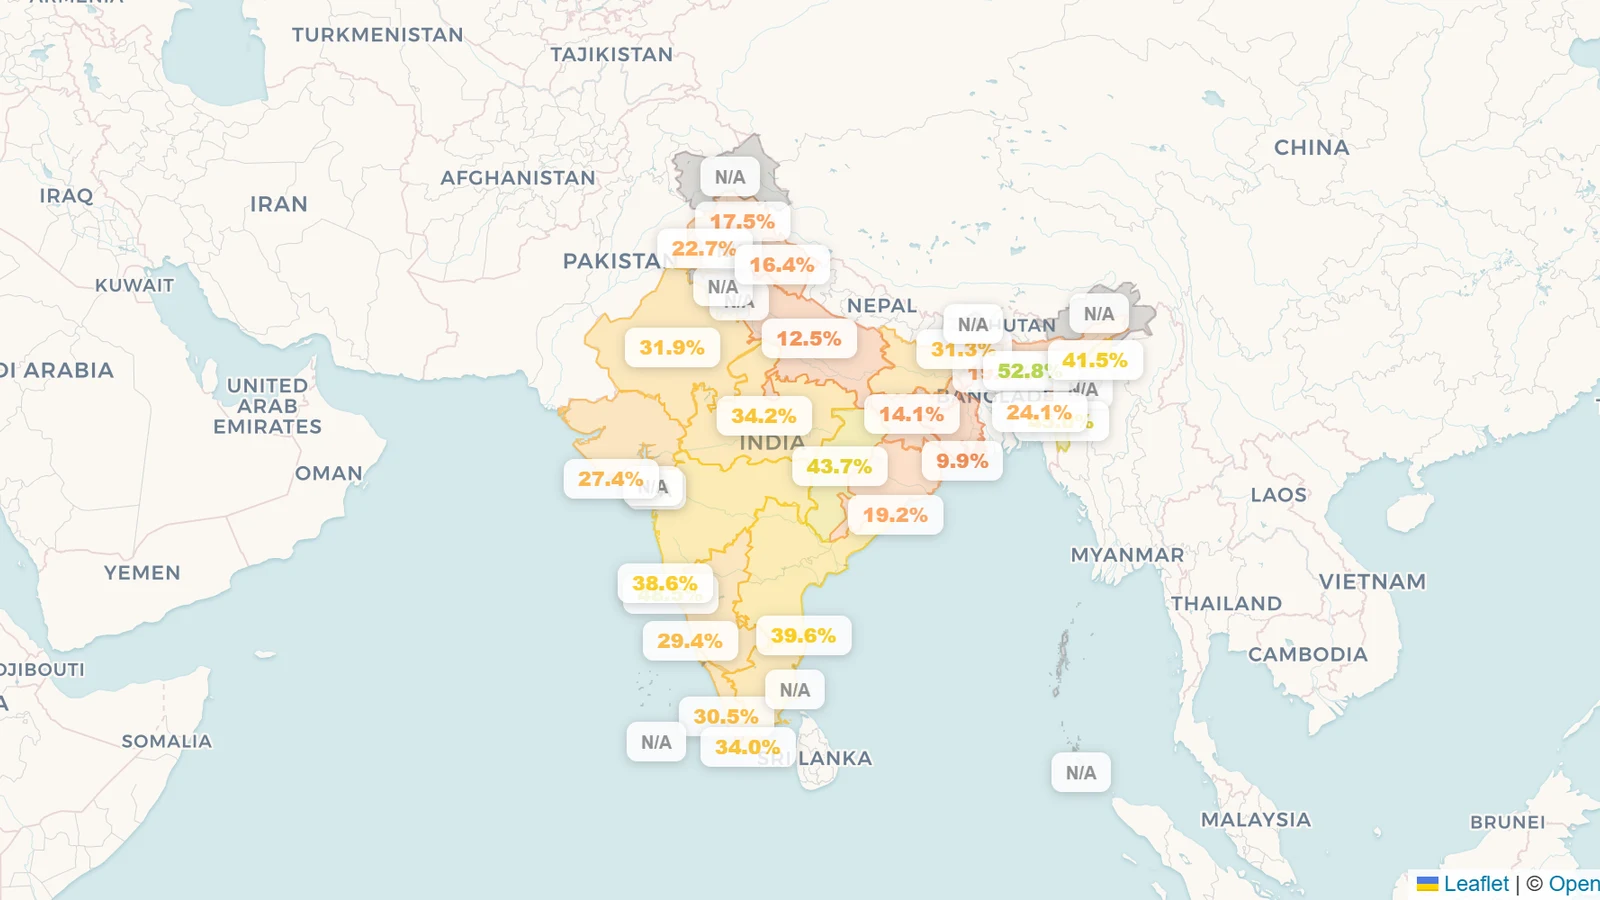
India's tracked reservoirs added 11.6 km³ of water in a single week — the clearest monsoon turnaround signal of 2026 so far. Across the 145 reservoirs that the Central Water Commission's weekly bulletin covered on both July 2 and July 9, combined live storage rose from 43,993 to 55,642 million m³, lifting the same-set fill from 20.6% to 26.1%. And the turnaround is lopsided in exactly the way a monsoon arrival should be: 103 of the 145 rose, led by Maharashtra's Western Ghats dams — Khadakvasla, the reservoir that supplies Pune, jumped from 15% to 99% full in seven days — while the east and south, where the rains have not yet delivered, stayed flat or kept falling. A week ago our Maharashtra status report described these same Ghats dams as unusually empty; this is what one wet week in the catchments did. Live figures for every dam are on the India page.
Key takeaways
- +11,649 million m³ in one week (July 2 → July 9, 2026). Same-source CWC readings across an identical 145-reservoir set; combined fill rose 20.6% → 26.1%. Live data on the India page.
- 103 reservoirs rose, 20 fell, 22 held flat. The risers are concentrated where the southwest monsoon burst: Maharashtra's tracked set gained +20.1 points of weighted fill in a week, Karnataka +12.0, Odisha +7.3.
- The Pune-area dams are the story. Khadakvasla 15% → 99%, Veer Dam 17% → 99.8%, Chaskaman 7% → 73%, Mulshi 10% → 67% — Sahyadri catchments converting monsoon rain into storage almost overnight.
- The east and south haven't turned yet. Andhra Pradesh's tracked set slipped −2.2 points, Telangana and Uttar Pradesh were flat, and Mahanadi (Chhattisgarh) and Omkareshwar (Madhya Pradesh) kept drawing down.
- 26% full is still a low absolute level. One strong week narrows, but does not erase, the deficit described in our July status report — the filling season has three months to run, and this is what its first good week looks like.
Where the data comes from — and how we compare weeks honestly
Both readings in every comparison below come from the same source: the Central Water Commission's weekly Reservoir Storage Bulletin (July 2 and July 9, 2026 editions), which reports live storage for ~166 major reservoirs nationwide. We compare a reservoir's two bulletin readings only with each other — never a bulletin figure against a state-portal figure — because different agencies measure against different storage bases and the mismatch can masquerade as a huge change. A concrete example from this very week: Nagarjuna Sagar reads 44% on Andhra Pradesh's AP-WRIMS portal (July 7) and 3.6% of live storage in the CWC bulletin (July 9). Neither is wrong; they answer different questions, so we never chart them as a trend. The 145 reservoirs in this analysis are exactly those with a CWC reading in both weeks; reservoirs the bulletin covered only once are excluded. Our sourcing rules are on the methodology page.
The week the monsoon reached the Sahyadris
The southwest monsoon's arrival over the Western Ghats turned the Krishna and Bhima headwater dams around in days. These are steep, high-rainfall catchments feeding relatively small reservoirs — when the rain comes, they fill fast, and this week they did:
Eight of the ten biggest weekly gains are Maharashtra dams, most of them in the Pune region. Khadakvasla — Pune's principal drinking-water reservoir — going from 15% to 99% in one bulletin cycle is the kind of swing that only happens in the Ghats, where a reservoir's whole catchment can sit under the monsoon band at once. For the people of Pune, the difference between those two numbers is the difference between a rationing summer and a normal one.
State by state: a monsoon map in numbers
Weighted fill across each state's CWC-tracked reservoirs, week over week:
| State |
Reservoirs |
Jul 2 |
Jul 9 |
Change |
| Maharashtra |
32 |
18.5% |
38.6% |
+20.1 |
| Karnataka |
16 |
17.4% |
29.4% |
+12.0 |
| Odisha |
11 |
12.0% |
19.2% |
+7.3 |
| Madhya Pradesh |
12 |
29.7% |
34.2% |
+4.4 |
| Gujarat |
17 |
24.6% |
27.4% |
+2.8 |
| Jharkhand |
7 |
11.7% |
14.1% |
+2.4 |
| Tamil Nadu |
5 |
19.3% |
21.1% |
+1.8 |
| Chhattisgarh |
6 |
42.5% |
43.7% |
+1.3 |
| Rajasthan |
8 |
31.0% |
31.9% |
+0.9 |
| Uttar Pradesh |
6 |
12.7% |
12.5% |
−0.1 |
| Telangana |
3 |
9.2% |
9.1% |
−0.1 |
| Andhra Pradesh |
4 |
37.9% |
35.8% |
−2.2 |
Read top to bottom, this table is a weather map. The monsoon band this week sat over the west coast and the central peninsula — Maharashtra, coastal Karnataka, Odisha's catchments — and the storage numbers follow it exactly. Below the band, the Karnataka recovery is worth flagging: a state whose July report we summed up as a wait for the rain, with its biggest dams near empty, added twelve points of weighted fill. Above and east of the band, Uttar Pradesh, Telangana and Andhra Pradesh are still waiting.
Where the water is still going down
Twenty reservoirs fell by more than half a point this week, and the list is as informative as the risers. Mahanadi in Chhattisgarh dropped 63.5% → 47.9% (−120 million m³) and Omkareshwar on the Narmada slipped 55.2% → 47.2% — reservoirs releasing water for irrigation and power while their own catchments wait for rain. Dantiwada in Gujarat is the starkest line in the bulletin: 25% to zero reported live storage in one week (−100 million m³). And Kol Dam in Himachal Pradesh fell 45.3% → 28.4%. A mid-monsoon drawdown is not automatically a drought signal — releases are operational decisions as much as weather outcomes — but every one of these is a reservoir spending storage it has not yet begun to replace.
What one good week does — and doesn't — mean
- The direction changed; the level is still low. 26.1% across the tracked set is a real improvement on 20.6%, but it is a low number for mid-July, and the July status picture — big northern and central storages at multi-year lows — is dented, not fixed.
- Ghats reservoirs fill fast and spill fast. The spectacular Pune-cluster numbers reflect small-to-mid reservoirs under intense rainfall. The big storages that carry India through the dry season — Indira Sagar (23.6% on July 9), Srisailam, Bhakra — move much more slowly, and they are the ones to watch through August.
- A week is a data point, not a season. The monsoon delivers most of its water between now and September. What this bulletin shows is that the machine has switched on — where it has rained, storage responded immediately. Whether 2026 ends as a recovery year depends on the next ten bulletins, and we will track them here.