California is heading into summer 2026 with its reservoirs in unusually good shape. As of 21 June 2026, the state's major reservoirs are holding about 82% of capacity — roughly 107% of the historical average for the date — and the big names are all above their seasonal norm: Shasta is around 81%, Oroville around 90%, Trinity Lake around 84% and Folsom around 94%. That is a world away from the last two big droughts: in June 2015 and June 2021 these same reservoirs sat between 35% and 51% full. A strong, above-average water position lowers the risk of the kind of water-supply emergency California faced in those years. One honest caveat up front: a full reservoir measures water in the bank, not the fire season — wildfire risk runs on weather and dry vegetation, not storage, and it stays unpredictable. The live US picture is on the United States reservoir levels page.
Key takeaways
- California's reservoirs are above average entering summer 2026 — about 82% of capacity statewide, roughly 107% of the historical average for the date (as of 21 June 2026). The live figures are on the United States page.
- Far above the drought years. Oroville is near 90% now versus 35% in June 2021; Shasta is around 81% versus 41% then. Several reservoirs are holding roughly double their drought-year levels.
- This is good news for water supply — it lowers the risk of the acute reservoir-shortage droughts of 2015 and 2021, and gives farms and cities a comfortable carryover going into the dry season.
- But it is a lagging indicator. Today's full reservoirs reflect the wet years of 2023–2025, not whether a new dry spell is starting. The leading signals — snowpack and the next rainy season — are what decide that.
- It is not a wildfire forecast. Fire risk depends on vegetation, heat, wind and humidity, not on how full the dams are. A wet run of years can even grow more grass and brush that later dries into fuel. Full reservoirs and a bad fire year can coexist.
Where the data comes from
There is no single national US reservoir bulletin; California's storage is published continuously by California's CDEC network (the Department of Water Resources) and by the US Bureau of Reclamation for the federal reservoirs such as Shasta. reservoirs.earth mirrors those readings, adds multi-year history, and rolls them up by state. Each figure below is dated, because reservoir levels change daily; the live numbers and each reservoir's chart are on the United States page and on each reservoir's own page.
The current picture (as of 21 June 2026)
California's tracked reservoirs hold about 82% of capacity, and — more usefully — about 107% of the historical average for this date. "Percent of average" is the number that matters: it compares today against the typical level for the same day across past years, so it tells you whether the state is wetter or drier than normal, not just how full the tanks are.
| Reservoir | Fill | % of average |
|---|---|---|
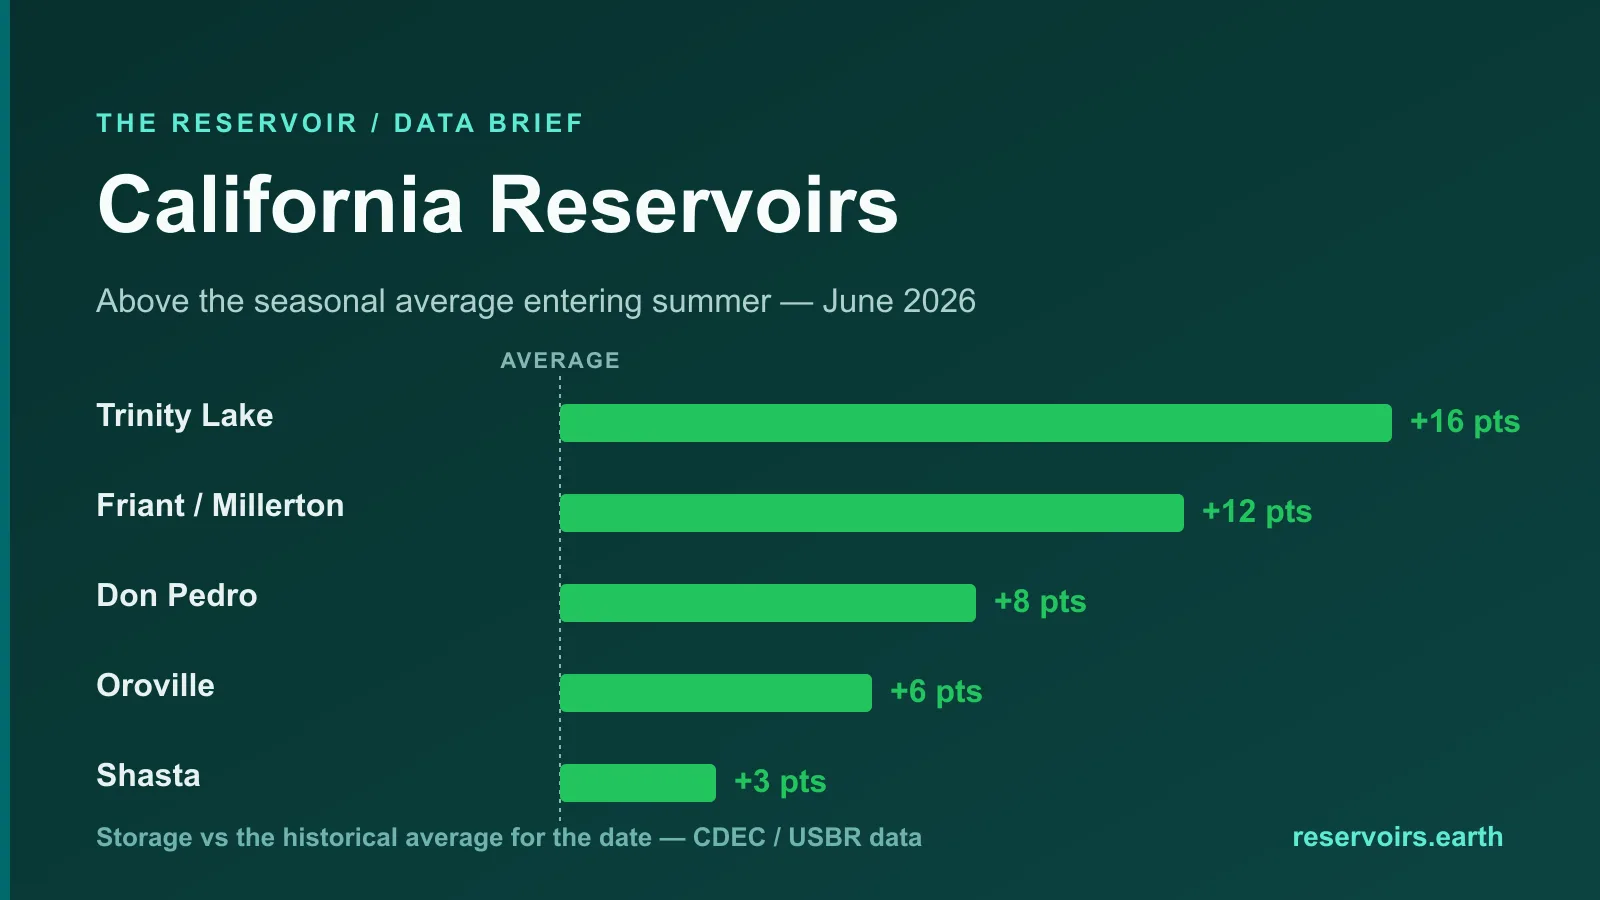
| Trinity Lake | 84% | 124% |
| Friant / Millerton | 93% | 114% |
| Don Pedro | 94% | 110% |
| Oroville | 90% | 107% |
| Shasta | 81% | 104% |
| Lake Berryessa | 92% | 110% |
A couple of reservoirs sit just below their norm — Pine Flat on the Kings River is around 91% of average — but the statewide picture is comfortably above the line. The full state breakdown is on the California page.
Far above the drought years
The clearest way to read "above average" is against the droughts everyone remembers. Here is the same set of reservoirs in mid-June of four years, from CDEC's record:
| Reservoir | June 2015 | June 2021 | June 2024 | June 2026 |
|---|---|---|---|---|
| Shasta | 51% | 41% | 92% | 81% |
| Oroville | 42% | 35% | 99% | 90% |
| Trinity | 40% | 50% | 86% | 84% |
| Folsom | 51% | 34% | 96% | 94% |
In June 2015 — the fourth year of the 2012–2016 drought — essentially the entire state was in drought and nearly half of California was in the most extreme category (per the US Drought Monitor), and the reservoirs were drawn down to match. June 2021 was similar. Today's reservoirs are holding roughly double their 2021 levels at some of these sites. That is the headline: 2026 is not a drought year for California's stored water.
What full reservoirs do — and don't — tell you
This is where reservoirs.earth tries to be more careful than a "California is fine" headline.
- They tell you about water supply, and about the recent past. A reservoir is a multi-year store. Today's high levels are carryover from the wet winters of 2023, 2024 and 2025 — the system filled up and has not yet been drawn down. So the reservoir is a lagging indicator: it reports the water California banked over several years, not the weather of the next few months.
- They lower water-supply drought risk, not drought in general. Drought has several faces — meteorological (rainfall), hydrological (streamflow), agricultural (soil moisture). Full reservoirs directly address the water-supply face: cities, irrigation districts and hydropower have a cushion this summer that they did not have in 2015 or 2021. Whether a new drought begins depends on next winter's rain and snow, which storage cannot forecast.
- They are not a wildfire forecast. This is the caveat to hold onto. Wildfire risk is governed by fuel — how dry the grass, brush and timber are — plus heat, wind and humidity. Reservoir storage is not an input. In fact, a wet run of years grows more vegetation that can cure into fuel by late summer. California has had severe fire seasons after wet winters. So full reservoirs are genuinely good news for water, and say almost nothing about the fire season, which remains, as everyone who lives there knows, unpredictable.
Why the reservoirs are so full
California's water year swings hard between wet and dry. After the deep 2020–2022 drought, the state had a run of wet-to-normal years: the atmospheric-river winter of 2023 refilled the big reservoirs, and 2024 and 2025 kept them high. Reservoirs are built to carry that surplus across years, which is exactly what they are doing now. The 2026 snowpack matters for next year's refill, but the reservoirs entered this summer already loaded.
What it means for the summer
The practical read for 2026: California has a comfortable water-supply buffer. The acute reservoir-shortage scenarios of 2015 and 2021 — mandatory cutbacks driven by near-empty dams — are unlikely this year, because the dams are not near empty. That is real, and it is good news.
What the reservoirs cannot tell you is whether the next winter will be wet or dry, or how the fire season will go. Those depend on weather that has not happened yet. The honest summary is the one the data supports: strong reservoirs, a healthy water-supply position, and a year that looks far better than the recent droughts — with the fire season a separate question that storage does not answer.
FAQ
What are California's reservoir levels right now? About 82% of capacity statewide — roughly 107% of the historical average for the date — as of 21 June 2026. Shasta is around 81%, Oroville around 90%. The live figures are on the California page.
Is California in a drought in 2026? Not for its stored water. Reservoirs are above their seasonal average and far above the 2015 and 2021 drought lows, so the water-supply picture is strong. Whether a new meteorological drought develops depends on next winter's rain and snow, which reservoir levels cannot predict.
Do full reservoirs mean a quieter wildfire season? No. Wildfire risk is driven by vegetation dryness, heat and wind — not by reservoir storage. Full reservoirs are good news for water supply but are not a fire-season forecast, and big fire years have followed wet winters. Fire risk stays unpredictable.
How do today's levels compare with past years? Much higher than the droughts. In June 2021, Oroville was 35% full and Folsom 34%; in June 2026 they are around 90% and 94%. Each reservoir's multi-year chart is on its page.
Where does the data come from? California's CDEC network (Department of Water Resources) and the US Bureau of Reclamation, mirrored with multi-year history on reservoirs.earth.
This is a June 2026 snapshot of California; for the national picture and where drought risk actually sits across the US, see the United States reservoir levels editions, and how US water-data openness ranks on the Reservoir Transparency Index.