Reservoir · California · United States · CDEC
FOLSOM LAKE
38.0% full
Capacity
1,205.06 hm³
Volume stored
458 hm³
Vs month average
97% of normal
Coordinates
38.683°N, 121.183°W
Last updated
2026-11-01
Current fill
38.0%vs 7 days ago
-1.1 pplosing
vs 1 year ago
-5.1 ppyear-over-year
7-day trend
↓falling
Drought context
Storage vs November average
97%of normal
38.0% full on 2026-11-01, against an average of 39.1% for November across 6 years of readings (-1.1 points).
Drought Monitor at this site · 27 October 2026
D0abnormally dry
The ground at FOLSOM LAKE's coordinates falls inside the D0 area of the weekly U.S. Drought Monitor map. That describes local conditions — rainfall, soil moisture, streamflow — not the reservoir's storage. California drought figures →
Data source: CDEC — California Dept of Water Resources — daily reservoir storage volume. Capacity is the design (normal full-pool) capacity from the US National Inventory of Dams (NID); fill % = current volume ÷ design capacity. Last reading: 2026-11-01.
Catchment Weather
Past 30 days + 14-day forecast · Open-Meteo
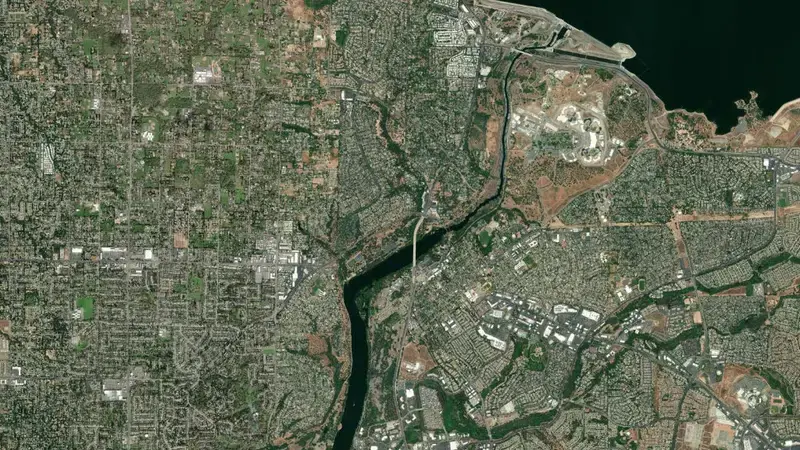
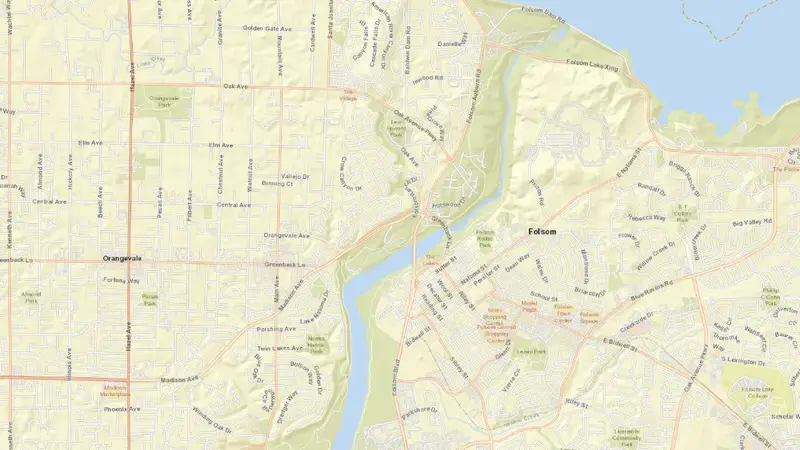
Satellite imagery: Esri, Maxar, Earthstar Geographics. Map: Esri, HERE, Garmin, © OpenStreetMap contributors. 38.683°N, 121.183°W · Open in Google Maps
About FOLSOM LAKE
As of November 1, 2026, FOLSOM LAKE is filled to 38.0% of its total capacity, holding 458.4 hm³ of water out of a maximum 1,205 hm³. At this level the reservoir is low.
Over the most recent week on record the fill level has fallen by 1.1 percentage points, and it is 5.1 points below its level on the same date a year earlier.
Across the readings we hold for FOLSOM LAKE — 1825 data points between November 3, 2021 and November 1, 2026 — the level has ranged from a low of 25.2% (December 1, 2022) to a high of 98.2% (May 12, 2026). On average the reservoir is fullest around June and at its lowest around November.
It is operated by CDEC primarily for multiple purposes. It is at 38.683°N, 121.183°W.
Key facts
- Current fill level
- 38.0% of total capacity
- Water stored
- 458.4 hm³
- Total capacity
- 1,205 hm³
- 7-day change
- ▼ 1.1 pp
- Year-on-year
- ▼ 5.1 pp
- Primary use
- Multipurpose
- Operator
- CDEC
- Coordinates
- 38.683°N, 121.183°W
- Last updated
- November 1, 2026
Recent readings
| Date | Fill level | Volume (hm³) |
|---|---|---|
| 1 Nov 2026 | 38.0% | 458.4 |
| 31 Oct 2026 | 38.1% | 459.29 |
| 30 Oct 2026 | 38.2% | 460.34 |
| 29 Oct 2026 | 38.4% | 462.3 |
| 28 Oct 2026 | 38.6% | 464.74 |
| 27 Oct 2026 | 38.8% | 467.1 |
| 26 Oct 2026 | 38.9% | 469.23 |
| 25 Oct 2026 | 39.1% | 470.96 |
| 24 Oct 2026 | 39.2% | 472.36 |
| 23 Oct 2026 | 39.3% | 473.76 |
| 22 Oct 2026 | 39.5% | 475.9 |
| 21 Oct 2026 | 39.7% | 478.15 |