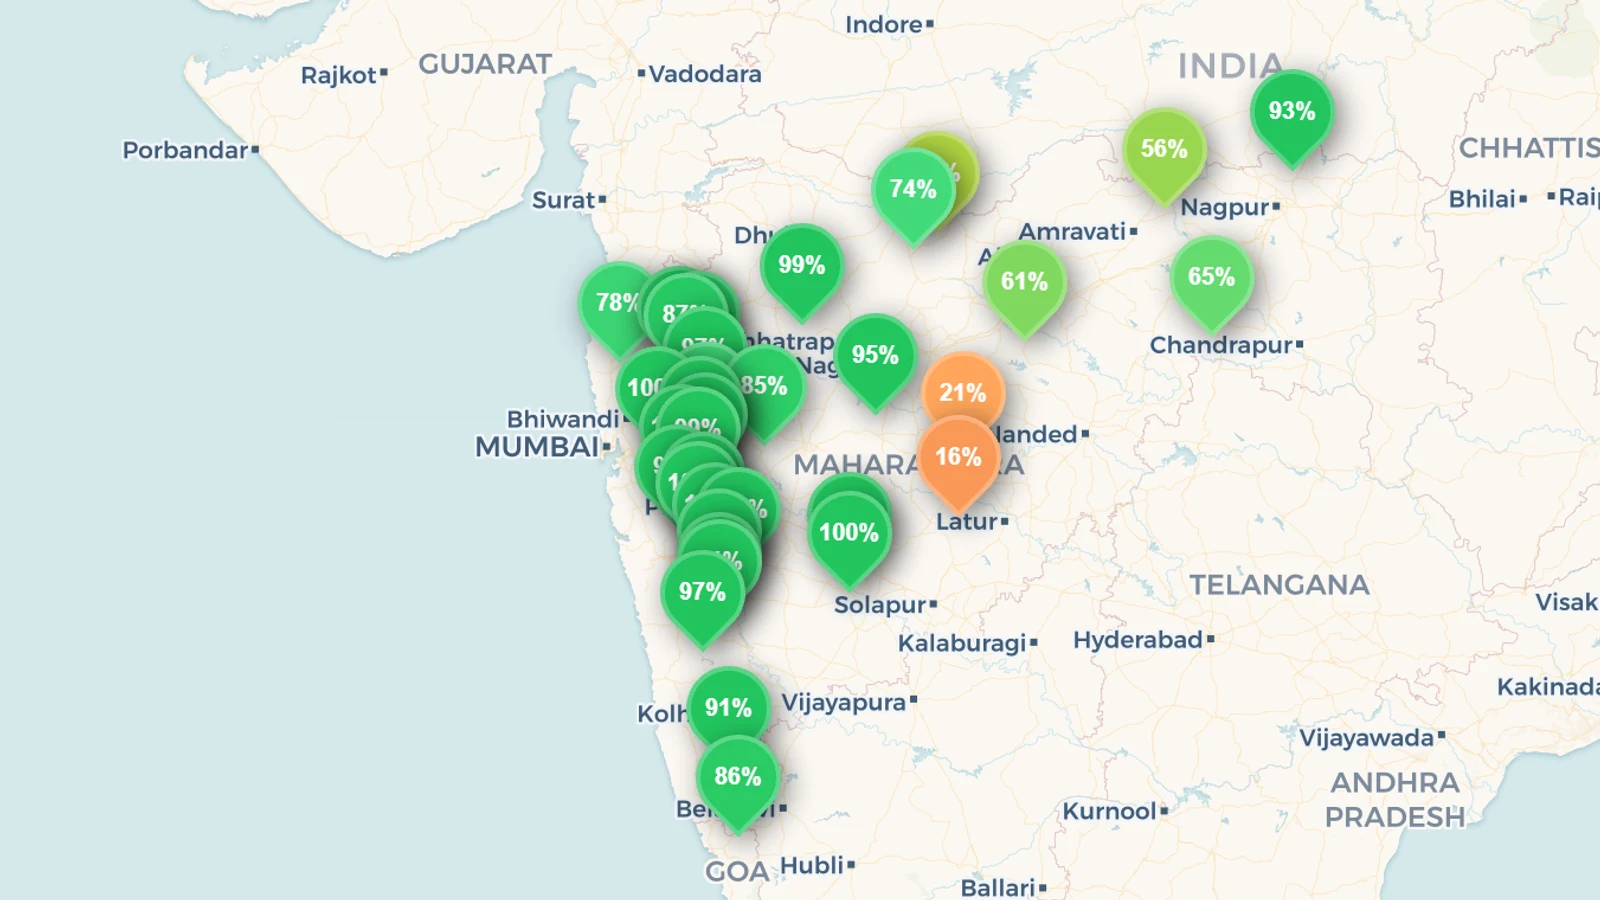
As of the CWC bulletin of 13 August 2026, Maharashtra's 35 major reservoirs are holding 83.2% of their combined capacity — a reversal of the state we described six weeks ago. In the July edition the Western Ghats dams were unusually empty at the seasonal floor: Koyna was 10.9% full, Mulshi 9.6%, and Ujjani, the state's largest dam, was at dead storage. They now read 96.8%, 95.5% and 95.0%. The state has gained 64.7 percentage points since 2 July, 22 of the 35 dams are above 90%, and only one — Manjara in Marathwada, at 15.9% — is below 20%. Maharashtra is also ahead of last year: on the 30 dams that reported on both dates, storage is 81.8% against 77.9% on 14 August 2025. The live state figure and the dam-by-dam map are on the Maharashtra reservoir levels page.
Key takeaways
- Maharashtra is 83.2% full (13 August 2026), up 12.2 points in a single week and 64.7 points since the 2 July bulletin. The live figure is on the Maharashtra page.
- The Western Ghats deficit is gone. Koyna went from 10.9% to 96.8%, above its 94% August average; Mulshi from 9.6% to 95.5%; Bhatghar from 8.8% to 100%.
- Ujjani came off dead storage to 95.0%. The state's largest reservoir (123.3 TMC) read 0% live storage in early July; it is now releasing water, down 3.8 points on the week.
- Marathwada's Jayakwadi is 95.1% full against a 51% August average — the widest positive gap in the state, and the reason the drought-prone region is not in the headlines this year.
- The state is ahead of 2025, by 3.9 points on a like-for-like basis (81.8% vs 77.9% on 14 August 2025, 30 dams reporting on both dates).
- The laggards are in Vidarbha and the coastal north. Upper Wardha is 56.4% against a 78% August average and Surya 77.9% against 93% — the only two dams with multi-year history running more than 5 points below normal.
- Fastest risers this week: Upper Tapi +10.3 points, Dudhganga +9.6, Dhom +5.6.
Maharashtra reservoir levels, dam by dam (13 August 2026)
Capacity is gross storage capacity, given in TMC (thousand million cubic feet, the unit used in Indian water reporting) and MCM (million cubic metres). "Week" is the change in percentage points since the 6 August bulletin; "August average" is the mean August level on each dam's own chart. Three dams joined our series in July 2026 and have no multi-year history yet, so their average reads "—".
| Dam |
Basin |
Capacity (TMC) |
Capacity (MCM) |
Fill, 13 Aug |
Week |
August average |
| Ujjani (Bhima) |
Bhima |
123.3 |
3,491 |
95.0% |
−3.8 |
65% |
| Jayakwadi (Nathsagar) |
Godavari |
102.7 |
2,909 |
95.1% |
+2.1 |
51% |
| Koyna |
Krishna |
93.7 |
2,652 |
96.8% |
+3.3 |
94% |
| Girna |
Godavari |
53.5 |
1,516 |
99.0% |
0.0 |
57% |
| Isapur |
Godavari |
34.1 |
965 |
65.4% |
+3.2 |
69% |
| Bhatsa |
West Flowing |
33.4 |
947 |
90.9% |
+1.4 |
89% |
| Yeldari |
Godavari |
29.9 |
847 |
60.8% |
+1.6 |
64% |
| Pench (Totladoh) |
Godavari |
29.2 |
828 |
93.2% |
0.0 |
81% |
| Bhatghar |
Krishna |
23.8 |
673 |
100.0% |
0.0 |
94% |
| Dudhganga |
Krishna |
23.4 |
664 |
90.5% |
+9.6 |
88% |
| Mula |
Krishna |
21.6 |
613 |
84.5% |
+3.9 |
79% |
| Upper Wardha |
Tapi |
19.9 |
564 |
56.4% |
+0.4 |
78% |
| Mulshi |
Krishna |
19.6 |
555 |
95.5% |
+5.2 |
91% |
| Nira Deoghar |
Krishna |
16.2 |
459 |
99.8% |
+1.9 |
96% |
| Upper Vaitarna |
West Flowing |
16.1 |
455 |
87.3% |
+1.5 |
91% |
| Majalgaon |
Godavari |
16.0 |
454 |
20.7% |
+2.4 |
— |
| Tillari |
West Flowing |
15.8 |
447 |
85.8% |
+1.9 |
85% |
| Dhom |
Krishna |
15.0 |
424 |
93.5% |
+5.6 |
88% |
| Dimbhe |
Krishna |
12.5 |
354 |
95.0% |
−0.3 |
90% |
| Thokarwadi |
Krishna |
12.5 |
353 |
99.9% |
+3.7 |
97% |
| Barvi |
West Flowing |
12.0 |
339 |
99.5% |
+2.2 |
97% |
| Darna |
Godavari |
11.7 |
332 |
87.6% |
0.0 |
91% |
| Bhandardara (Wilson Dam) |
Godavari |
11.1 |
314 |
97.1% |
0.0 |
95% |
| Panshet |
Krishna |
10.8 |
307 |
99.9% |
−0.1 |
96% |
| Manikdoh |
Krishna |
10.2 |
288 |
76.3% |
+4.5 |
55% |
| Surya |
West Flowing |
9.7 |
276 |
77.9% |
+2.8 |
93% |
| Urmodi |
Krishna |
9.6 |
273 |
94.1% |
+1.5 |
82% |
| Kanher |
Krishna |
9.6 |
272 |
94.3% |
+1.0 |
87% |
| Veer |
Krishna |
9.4 |
266 |
100.0% |
+2.3 |
91% |
| Upper Tapi |
Tapi |
9.0 |
255 |
52.5% |
+10.3 |
36% |
| Manjara |
Godavari |
8.8 |
250 |
15.9% |
−0.5 |
— |
| Waghur |
Tapi |
8.8 |
248 |
73.5% |
+2.0 |
— |
| Bhama Askhed |
Krishna |
7.7 |
217 |
98.5% |
−0.2 |
92% |
| Chaskaman |
Krishna |
7.6 |
215 |
99.8% |
0.0 |
98% |
| Khadakvasla |
Krishna |
2.0 |
56 |
99.8% |
0.0 |
79% |
| State total |
— |
850.3 |
24,078 |
83.2% |
+12.2 |
— |
Where Maharashtra's reservoir data comes from
The figures here come from the Central Water Commission (CWC), India's national water agency, whose weekly bulletin covers the country's largest reservoirs. reservoirs.earth mirrors that bulletin and keeps each dam's multi-year history; the most recent reading in this snapshot is 13 August 2026, and all 35 of the state's tracked dams reported. The state percentage is capacity-weighted — total water stored divided by total capacity — so Ujjani, Jayakwadi and Koyna, which between them hold 37% of the state's tracked capacity, move the headline far more than the Pune-area dams do. India's national water data is harder to access than most countries we track, which is why India scores low on the Reservoir Transparency Index; the CWC bulletin nonetheless covers Maharashtra thoroughly, at 35 dams the largest set of any state we publish.
Six weeks that changed the year
Read the season bulletin by bulletin and the turn is abrupt:
| Bulletin |
25 Jun |
2 Jul |
9 Jul |
16 Jul |
23 Jul |
30 Jul |
6 Aug |
13 Aug |
| Maharashtra, % full |
17.7% |
18.5% |
38.6% |
41.3% |
49.4% |
64.2% |
71.0% |
83.2% |
(32 dams reported through 9 July; three more entered the series on 16 July, and 35 have reported since.)
The state added 20.1 points in the week to 9 July and another 12.2 in the week to 13 August, with no flat spell in between. That matches the national picture: the week of 6 August tracker recorded the biggest single-week refill of the season across India, and the rain has kept working down the Western Ghats since.
The contrast with the rest of the country is the story of this edition. On the same 13 August bulletin, India as a whole is 51.3% full, Madhya Pradesh 50.9% and Gujarat 48.6%. Maharashtra at 83.2% and Karnataka at 87.7% are the two large states that have already banked their year. The monsoon has been generous on the western side of the Deccan and stingy in the central Indian catchments.
The Ghats and the Bhima: from floor to full
The dams that made July's story alarming are the ones that recovered fastest, which is exactly what high-rainfall catchments do once the rain settles over them:
- Koyna (96.8%, +3.3) — Maharashtra's hydropower backbone was 10.9% full on 2 July. It is now marginally above its 94% August average and 8.2 points above the same week in 2025.
- Mulshi (95.5%, +5.2) and Thokarwadi (99.9%, +3.7) — the Tata hydro storages west of Pune, both above their August averages and both well ahead of last year (Mulshi 83.2% in 2025).
- Ujjani (95.0%, −3.8) — the biggest turnaround in the state. Ujjani's live storage was exhausted in early July, reading 0%; it filled through the Bhima's monsoon inflow and is now being drawn down again, which is what the negative week means: releases for downstream irrigation, not a failing catchment.
- The Pune cluster is effectively full: Panshet 99.9%, Khadakvasla 99.8%, Chaskaman 99.8%, Bhama Askhed 98.5%, Dimbhe 95.0%, Mula 84.5%. In a filled year the number to watch stops being the level and becomes the release schedule.
- Mumbai's supply is comfortable: Bhatsa 90.9% against an 89% average, Barvi 99.5%, though Upper Vaitarna at 87.3% is a little under its 91% norm.
Marathwada is full — except for two dams
Marathwada usually supplies India's drought coverage, and this year it mostly does not. Jayakwadi is 95.1% full against a 51% August average — the region's lifeline on the Godavari, 44 points above normal, having climbed from 31.1% on 23 July. Girna (99.0% against 57%) and Manikdoh (76.3% against 55%) show the same pattern.
Two dams do not: Manjara at 15.9%, the lowest reading in the state and falling half a point on the week, and Majalgaon at 20.7%. Both sit in the Manjara sub-basin in eastern Marathwada, both joined our series in July 2026, and neither has the multi-year history that would tell you whether this is normal for them in August — so we publish the level and not a verdict. What can be said from the seed is that they have barely moved all season: Manjara has traded between 15.3% and 16.6% across five bulletins while the state around it gained 65 points.
Vidarbha is the real laggard
The east of the state is the one region still visibly behind:
- Upper Wardha (56.4%, +0.4) against a 78% August average — the largest negative gap of any dam in Maharashtra with real history, and it gained almost nothing this week.
- Yeldari (60.8%) and Isapur (65.4%) are near their averages (64% and 69%) but far below where they stood a year ago — Isapur was 94.5% on 14 August 2025, a 29-point drop year on year.
- Pench (Totladoh) (93.2%) is the exception in Vidarbha, 12 points above its August average and 31 points above last year.
- On the coast, Surya (77.9% against 93%) is the other dam meaningfully under normal, though it did gain 2.8 points this week.
Capacity in TMC: how to read these numbers
Indian water reporting measures storage in TMC — one thousand million cubic feet, equal to 28.3168 million cubic metres (MCM). International sources, including most of reservoirs.earth, publish MCM or km³. The table above gives both, so the figures line up with state bulletins and news coverage:
- Ujjani (Bhima): 123.3 TMC gross capacity (3,491 MCM) — the largest in Maharashtra.
- Jayakwadi: 102.7 TMC (2,909 MCM).
- Koyna: 93.7 TMC (2,652 MCM).
- Mulshi: 19.6 TMC (555 MCM).
- Thokarwadi: 12.5 TMC (353 MCM).
- Chaskaman: 7.6 TMC (215 MCM).
- Maharashtra, all 35 tracked dams: 850.3 TMC (24,078 MCM).
Two cautions. Gross capacity is not usable water: every dam holds a dead-storage volume below its intakes, and CWC reports live storage against its own live-capacity figure, so a percentage and a volume taken from different sources will not always reconcile — Ujjani reading 0% in early July is the clearest example, because the reservoir still held water below the outlet. And a percentage is always a snapshot: these are the levels in the 13 August 2026 bulletin, and in a filling August a dam can move ten points in a week — compare each dam to the same week in earlier years on its own chart rather than to its annual average.
What to watch in September
The southwest monsoon normally withdraws from Maharashtra by early October, so the filling season has roughly six or seven bulletins left, and for most of the state the question has already flipped from will it fill to how it is managed.
Does Ujjani keep falling? A dam at 95% in mid-August with the monsoon still running is a release-management story, and the Bhima's downstream irrigation depends on how much is held back for the rabi season. Does Upper Wardha close its 22-point gap before the rains leave Vidarbha, or does eastern Maharashtra go into the dry season short? And do Manjara and Majalgaon move at all — five bulletins of a flat line in a state that gained 65 points is the one genuinely unresolved reading here. The honest summary: Maharashtra has had a good monsoon, has banked more water than at this point last year, and its remaining problems are two sub-basins, not the state.
This is the August 2026 edition, following India Reservoir Levels, August 2026 for the national picture and the week of 6 August monsoon tracker. It updates the July 2026 edition, whose story it reverses. We track the major Indian water economies month by month — see the Madhya Pradesh and Karnataka editions — and you can follow Maharashtra between bulletins on the Maharashtra reservoir levels page.