
Reservoir · Maharashtra · India · CWC · WESTERN region
Manikdoh
90.1% full
Gross capacity
10.2 TMC (288 MCM)
Live capacity
10.2 TMC (288 MCM)
Primary use
multiple
Operator
CWC
Coordinates
19.236°N, 73.814°E
Last updated
2026-09-10
Capacity in TMC
Manikdoh Dam has a gross capacity of 10.2 TMC (288 MCM); it is currently at 90% full, holding 9.1 TMC (259 MCM).
- Gross capacity
- 10.2 TMC (288 MCM)
- Live capacity
- 10.2 TMC (288 MCM)
- Current storage
- 9.1 TMC (259 MCM)
TMC is thousand million cubic feet, the unit used in Indian water reporting. 1 TMC = 28.3168 million cubic metres (MCM). Figures are converted from the Central Water Commission bulletin, which publishes million cubic metres.
Current fill
90.1%vs 7 days ago
+1.6%gaining
vs 1 year ago
+21.7%year-over-year
7-day trend
↑rising
Weekly storage
Fill history — multi-year
About this reservoir
Data source
official
Storage data: CWC (Central Water Commission) Weekly Storage Bulletin, India. CWC region: WESTERN.
Catchment Weather
Past 30 days + 14-day forecast · Open-Meteo
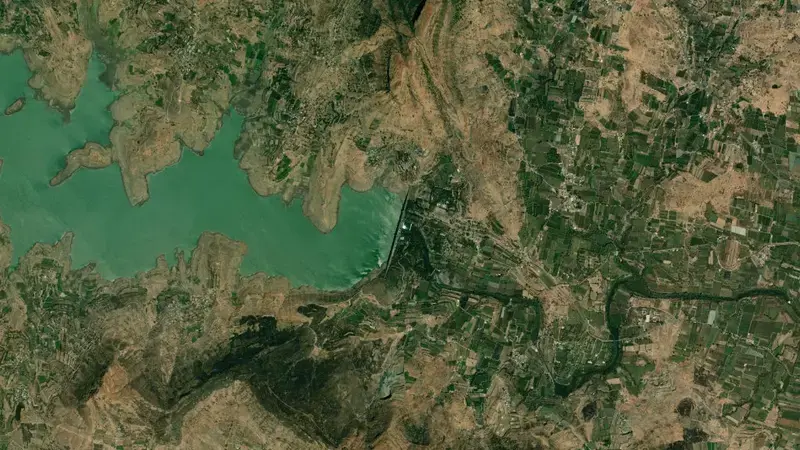
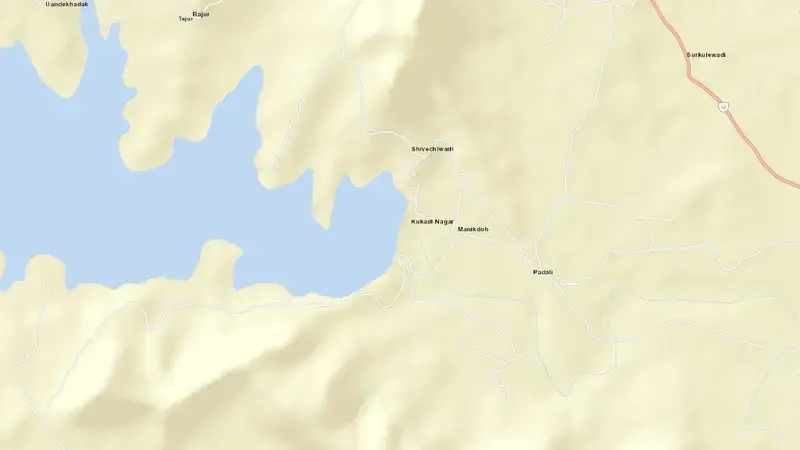
Satellite imagery: Esri, Maxar, Earthstar Geographics. Map: Esri, HERE, Garmin, © OpenStreetMap contributors. 19.236, 73.814 · Open in Google Maps
About Manikdoh
As of September 10, 2026, Manikdoh is filled to 90.1% of its total capacity, holding 9.1 TMC (259 MCM) of a gross 10.2 TMC (288 MCM). At this level the reservoir is high.
Over the most recent week on record the fill level has risen by 1.6 percentage points, and it is 21.7 points above its level on the same date a year earlier.
Across the readings we hold for Manikdoh — 166 data points between June 8, 2023 and September 10, 2026 — the level has ranged from a low of 2.0% (May 22, 2024) to a high of 90.1% (September 10, 2026). On average the reservoir is fullest around October and at its lowest around May.
It is operated by CWC primarily for multiple purposes.
Key facts
- Current fill level
- 90.1%
- Water stored
- 9.1 TMC (259 MCM)
- Total capacity
- 10.2 TMC (288 MCM)
- 7-day change
- ▲ 1.6 pts
- Year-on-year
- ▲ 21.7 pts
- Primary use
- Multipurpose
- Operator
- CWC
- Coordinates
- 19.236°N, 73.814°E
- Last updated
- September 10, 2026
Recent readings
| Date | Fill level | Volume (hm³) |
|---|---|---|
| 10 Sep 2026 | 90.1% | 259 |
| 3 Sep 2026 | 88.5% | 255 |
| 27 Aug 2026 | 86.2% | 248 |
| 20 Aug 2026 | 81.3% | 234 |
| 13 Aug 2026 | 76.3% | 220 |
| 6 Aug 2026 | 71.9% | 207 |
| 30 Jul 2026 | 54.4% | 157 |
| 23 Jul 2026 | 41.8% | 120 |
| 16 Jul 2026 | 34.1% | 98 |
| 9 Jul 2026 | 32.9% | 95 |
| 2 Jul 2026 | 4.5% | 13 |
| 25 Jun 2026 | 4.2% | 12 |