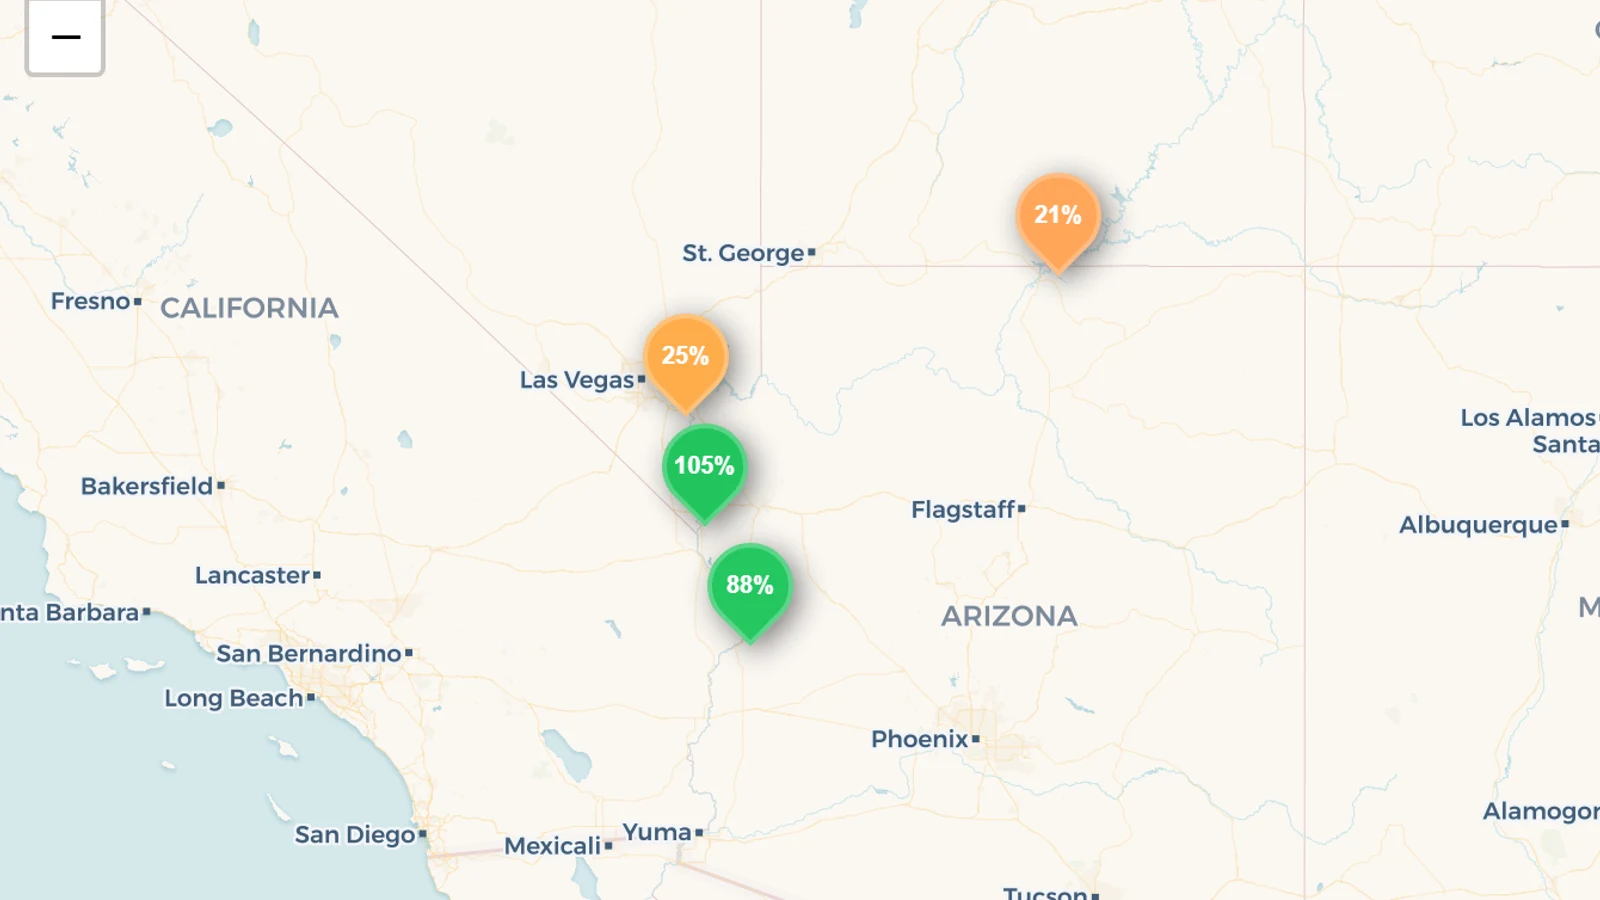
Lake Mead was 24.7% full on 12 August 2026 — 8,592 million cubic metres, or about 6.97 million acre-feet of a 28.26 maf capacity, behind Hoover Dam on the Nevada–Arizona line. That is the lowest reading in the five years of daily Bureau of Reclamation data we hold, below even the summer of 2022, and it is 3.6 points down on the same date last year. The largest reservoir in the United States, the water bank for roughly 40 million people across seven states and Mexico, has now fallen every single month since February.
Key takeaways
- Lake Mead is 24.7% full as of 12 August 2026 — about 6.97 million acre-feet stored against a total capacity of 28.26 maf, from US Bureau of Reclamation daily readings.
- It is the lowest level in our five-year record. The previous mid-August low was 25.1% in 2022; a year ago the same date read 28.3%. The reservoir has lost about 1.04 million acre-feet in twelve months.
- The year peaked on 27 February at 31.5% and has declined every month since — a fall of 6.8 percentage points, or roughly 1.92 million acre-feet, in under six months.
- The decline is slowing, and that is not good news. Mead lost only 0.7 points in the last 30 days, against 3.3 points over 90 days, because it is being propped up by releases from Lake Powell upstream — which has fallen more than twice as fast, 7.9 points year-on-year.
- Together, the Colorado's two giants hold 23.0% of capacity — 12.25 million acre-feet of a combined 53.28 maf. That is the water bank behind the 20% cuts Reclamation finalised on 31 July 2026.
Lake Mead water level today
|
Value |
| Fill |
24.7% full |
| Storage |
8,592 MCM · ~6.97 million acre-feet |
| Total capacity |
34,852 MCM · 28.26 million acre-feet |
| Reading date |
12 August 2026 |
| Change on the year |
−3.6 points (28.3% on 12 Aug 2025) |
| Change since the 2026 peak |
−6.8 points (31.5%, 27 Feb 2026) |
| Against our August average |
−4.0 points (5-year August mean: 28.7%) |
| Source |
US Bureau of Reclamation (BOR RISE), site BOR-3514 |
Live daily figures, the full chart and the five-year history are on the Lake Mead data page.
Six Augusts, one direction
The single most useful thing you can do with a reservoir number is compare it to the same date in other years. Same reservoir, same source, same day of the calendar:
| 12 August |
Fill |
Storage (maf) |
| 2021* |
31.9% |
9.02 |
| 2022 |
25.1% |
7.10 |
| 2023 |
30.6% |
8.64 |
| 2024 |
30.3% |
8.56 |
| 2025 |
28.3% |
8.00 |
| 2026 |
24.7% |
6.97 |
* Our daily record for Mead begins 15 August 2021, so the 2021 row is that date.
Two things stand out. First, 2026 is the lowest of the six — the 2022 crisis, which produced the "bathtub ring" photographs that went worldwide, was 0.4 points shallower than where the reservoir sits today. Second, the partial recovery of 2023 and 2024, bought by an exceptional 2023 snowpack, has been fully given back in two years.
The year in one line: peaked in February, downhill ever since
Lake Mead's highest point in 2026 was 31.5% on 27 February. Every month since has closed lower than it opened:
- February: 31.5% (the year's peak)
- April: 30.3% → 28.8%
- June: 27.1% → 25.8%
- August: 25.0% → 24.7% (to 12 August)
That is a loss of roughly 1.92 million acre-feet in under six months — more water than the entire annual allocation of the state of Nevada, gone from storage in half a year.
Why Mead is falling more slowly than Powell
Mead lost 0.7 points in the last 30 days. Lake Powell, 300 miles upstream behind Glen Canyon Dam, lost 0.9 points over the same period and 7.9 points over the year against Mead's 3.6.
The reason is structural, not meteorological. Powell sits upstream of Mead, and water released through Glen Canyon Dam flows down the Grand Canyon and into Mead. When Reclamation wants to hold Mead up — to protect deliveries to Arizona, California, Nevada and Mexico, and to keep Hoover Dam generating — the water comes out of Powell. The two reservoirs are one accounting system with a canyon in between, which is why reading either one alone gives you a misleading picture.
The combined figure is the honest one: 23.0% full, 12.25 million acre-feet of a possible 53.28. The river's entire multi-year savings account is a bit less than a quarter full.
What 24.7% actually means
A percentage is not a crisis threshold, so it is worth being precise about what the number does and does not tell you.
It is a stock, not a flow. Mead is not a reservoir that refills from local rain; it is filled by the Colorado River, which is fed by snowpack in the Rockies hundreds of miles upstream. What is in the lake today is what four decades of allocation decisions and two decades of a drier basin have left in it.
Two operating thresholds matter more than the percentage. Reclamation's published critical elevations for Mead are minimum power pool at 950 feet, below which Hoover Dam can no longer reliably generate electricity, and dead pool at 895 feet, below which water can no longer pass downstream through the dam's outlets at all. We publish storage volume rather than elevation for Mead, because volume is what the Bureau of Reclamation feed we ingest provides; for the daily elevation reading, Reclamation's own report is the primary source.
Evaporation is a permanent tax on the balance. Roughly 1.9 million acre-feet a year — about 13% of the entire Colorado River — is lost to evaporation across the system, with Mead alone giving up an estimated 600,000 to 860,000 acre-feet. In a hot year the lake loses a meaningful fraction of a state's allocation to the sky.
What to watch next
- The winter snowpack in the Upper Basin, which lands in Powell first and reaches Mead only through releases. A weak snow year shows up in Mead's number a year later.
- Whether Powell can keep subsidising Mead. At 21.1% and 0.1 points off its own record low, Powell's capacity to prop up the lower reservoir is close to exhausted. When that stops, Mead's rate of decline should accelerate.
- The shortage tier for 2027, which Reclamation sets from Mead's projected 1 January elevation — the direct mechanism by which this number becomes mandatory cuts in Arizona, Nevada and Mexico.
We update this page monthly. The daily figure is always live on the Lake Mead data page, alongside the rest of the United States.
Reservoir figures: US Bureau of Reclamation (BOR RISE), reading dated 12 August 2026; capacity from the National Inventory of Dams. Historical comparisons are our own, computed on the same source and the same calendar date. Colorado River evaporation — Bureau of Reclamation-linked research. Operating elevations — US Bureau of Reclamation published criteria. Updated monthly.