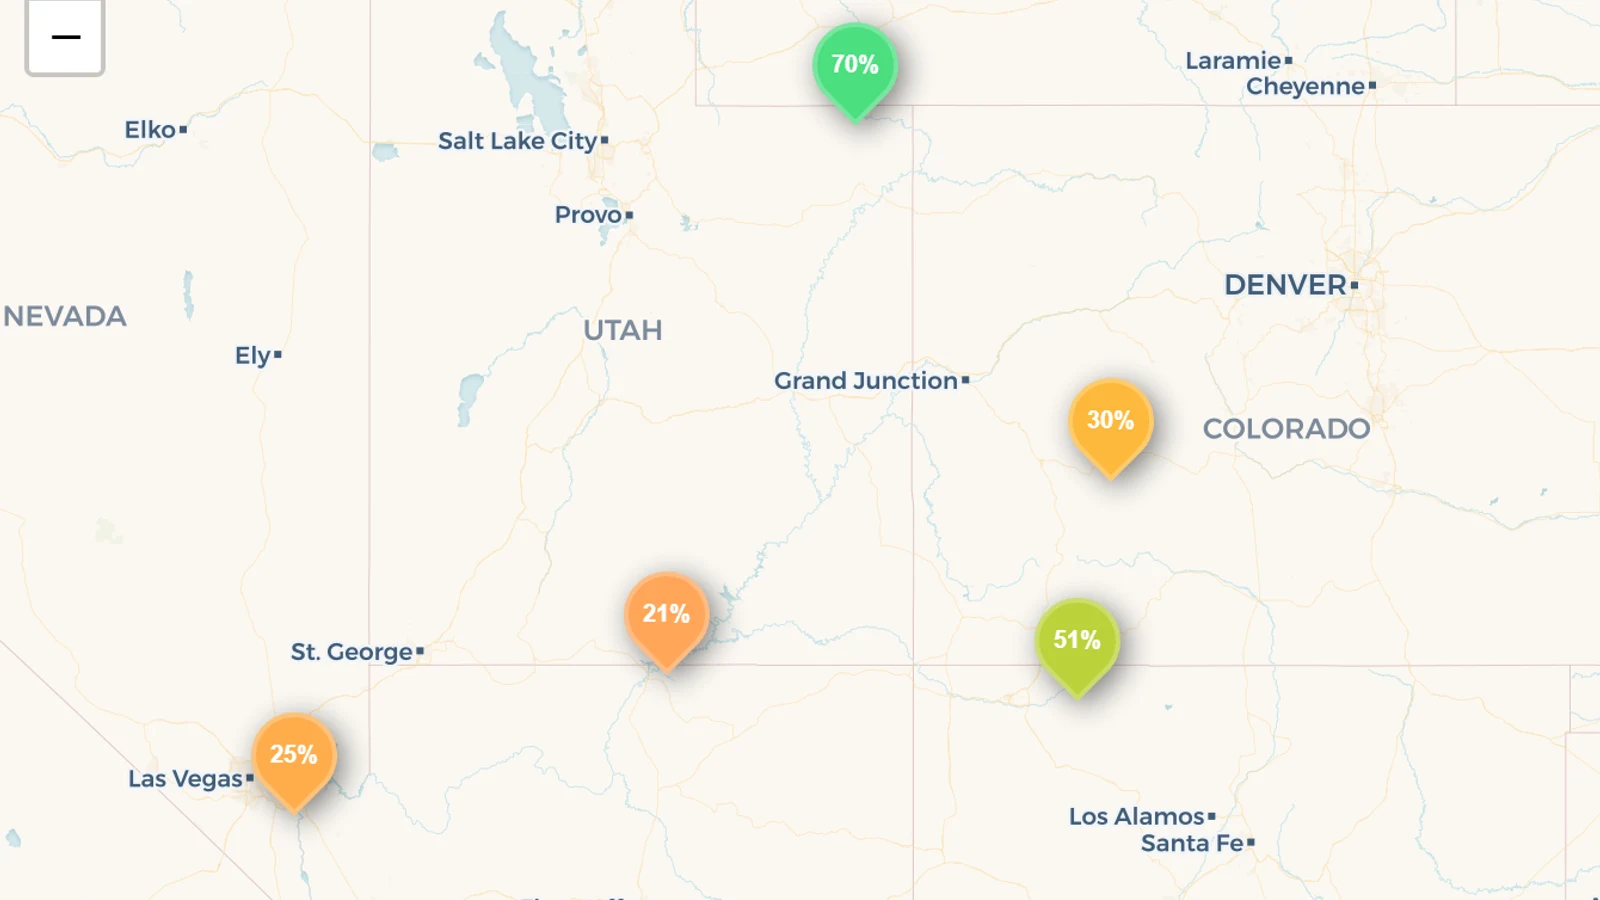
Lake Powell was 21.1% full on 12 August 2026 — 6,516 million cubic metres, or about 5.28 million acre-feet of a 25.03 maf capacity, behind Glen Canyon Dam on the Utah–Arizona line. That is 0.1 percentage points above the lowest reading in our entire five-year record (21.0% on 11 April 2023), and 7.9 points below where it stood a year ago. The number that explains the year, though, is a date: Lake Powell's highest level of 2026 was on 1 January. The snowmelt season that is supposed to refill it never really arrived.
Key takeaways
- Lake Powell is 21.1% full as of 12 August 2026 — about 5.28 million acre-feet against a total capacity of 25.03 maf, from US Bureau of Reclamation daily readings.
- It is within 0.1 points of its record low in our five-year daily record, set at 21.0% on 11 April 2023.
- The entire 2026 spring runoff was worth 0.4 percentage points. Powell rose from 22.4% to 22.8% across May — the only monthly gain of the year — then resumed falling. Its peak for 2026 was 25.8%, on 1 January.
- It has lost 7.9 points and about 1.99 million acre-feet in twelve months, more than twice the rate of Lake Mead downstream — because Powell is the reservoir being drained to hold Mead up.
- Powell is 9.7 points below its own August norm (30.8% across our five-year record), the widest gap to normal of the two giants.
Lake Powell water level today
|
Value |
| Fill |
21.1% full |
| Storage |
6,516 MCM · ~5.28 million acre-feet |
| Total capacity |
30,869 MCM · 25.03 million acre-feet |
| Reading date |
12 August 2026 |
| Change on the year |
−7.9 points (29.0% on 12 Aug 2025) |
| Change since the 2026 peak |
−4.7 points (25.8%, 1 Jan 2026) |
| Against our August average |
−9.7 points (5-year August mean: 30.8%) |
| Record low in our record |
21.0% · 11 April 2023 |
| Source |
US Bureau of Reclamation (BOR RISE), site BOR-393 |
Live daily figures and the full five-year chart are on the Lake Powell data page.
The refill that didn't happen
This is the part worth dwelling on, because it is unusual even by the standards of a drought.
Lake Powell is a snowmelt reservoir. In a normal year it draws down through autumn and winter, bottoms out in March or April, then fills through May, June and July as the Rocky Mountain snowpack melts and comes down the Green and Colorado rivers. Our five-year monthly averages show exactly that shape: a low near 25.8% in April, rising to a peak around 31.1% in July.
In 2026 the curve is almost flat, and it points down:
| 2026 |
Start of month |
End of month |
| January |
25.8% |
24.5% |
| February |
24.5% |
23.6% |
| March |
23.5% |
22.9% |
| April |
22.8% |
22.5% |
| May |
22.4% |
22.8% |
| June |
22.8% |
22.4% |
| July |
22.3% |
21.5% |
| August |
21.5% |
21.1% (to 12 Aug) |
May is the only month that gained, and it gained 0.4 points. That is the whole 2026 snowmelt season, in a reservoir built to capture it. The high-water mark for the year was set on New Year's Day, before the snow had even finished falling.
Six Augusts at Glen Canyon
| 12 August |
Fill |
Storage (maf) |
| 2021* |
30.7% |
7.67 |
| 2022 |
24.3% |
6.09 |
| 2023 |
36.4% |
9.12 |
| 2024 |
38.0% |
9.50 |
| 2025 |
29.0% |
7.27 |
| 2026 |
21.1% |
5.28 |
* Our daily record begins 15 August 2021, so the 2021 row is that date.
The 2023 and 2024 readings are the signature of one exceptional winter: the 2023 Rocky Mountain snowpack lifted Powell by twelve points and bought the basin two comfortable years. Both have now been spent, and then some — 2026 is 16.9 points below 2024, a loss of about 4.2 million acre-feet in two years.
Powell is the reservoir paying for Mead
Compare the two giants over the last twelve months:
|
Lake Powell |
Lake Mead |
| Fill, 12 Aug 2026 |
21.1% |
24.7% |
| Change on the year |
−7.9 points |
−3.6 points |
| Volume lost in 12 months |
~1.99 maf |
~1.04 maf |
| Below its own August norm |
−9.7 points |
−4.0 points |
Powell sits upstream. Water released through Glen Canyon Dam runs down the Grand Canyon into Mead, where it is delivered to Arizona, California, Nevada and Mexico. When the Lower Basin needs water and Mead needs to stay above its operating thresholds, the water comes out of Powell — which is why the upstream reservoir is emptying at twice the rate of the downstream one.
That makes Powell the leading indicator of the two. It is where the shortage shows up first, and its remaining ability to subsidise Mead is what stands between the current managed decline and a sharper one. Read together, the two hold 23.0% of their combined capacity — 12.25 million acre-feet of a possible 53.28.
Why the level matters beyond the water
Hydropower. Glen Canyon Dam's generators depend on the height of water above them. Reclamation's minimum power pool for Powell is 3,490 feet; below that the dam stops producing electricity for the grid it has served since 1964. Dead pool — the elevation below which water cannot pass downstream through the dam's outlets at all — is 3,370 feet. We publish storage volume rather than elevation, because volume is what the Reclamation feed we ingest provides; Reclamation's own daily report is the primary source for the elevation reading.
Delivery obligations. Powell exists in large part to let the Upper Basin states meet their delivery obligations to the Lower Basin under the Colorado River Compact. A reservoir at one-fifth of capacity is a thin margin for a legal commitment measured in millions of acre-feet a year.
It sets up 2027. The 20% reduction Reclamation finalised on 31 July 2026 is calibrated against exactly these two numbers. Powell entering the winter this low means the basin starts its next water year with almost nothing banked upstream.
What to watch next
- The 2026–27 Upper Basin snowpack, which is the only thing that meaningfully refills Powell. Two consecutive weak years would put the reservoir at levels its operating rules were not written for.
- Whether Powell breaks its record low. At 21.1% it is 0.1 points away; on the current trajectory that is a question of weeks, not seasons.
- The balancing releases to Mead. Every acre-foot sent downstream to protect Mead comes out of a reservoir with less and less left to give.
We update this page monthly. The daily figure is live on the Lake Powell data page, and the wider picture is on our United States overview.
Reservoir figures: US Bureau of Reclamation (BOR RISE), reading dated 12 August 2026; capacity from the National Inventory of Dams. Monthly trajectory, year-on-year comparisons and five-year norms are our own, computed on the same source and the same calendar dates. Operating elevations — US Bureau of Reclamation published criteria. Updated monthly.