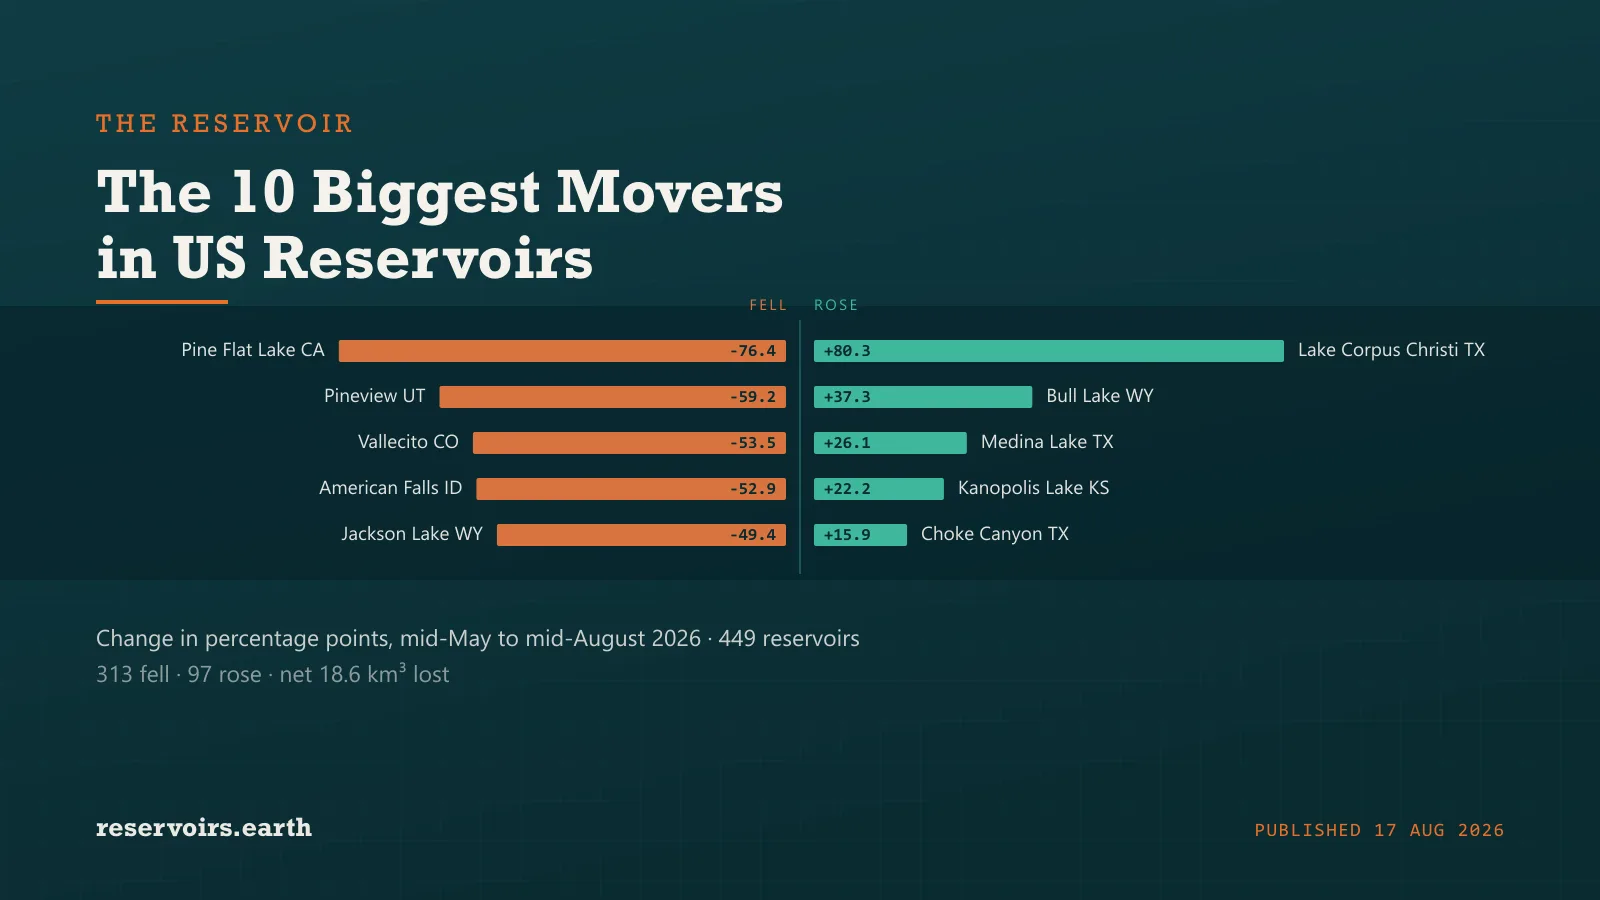
Between mid-May and mid-August 2026, 313 of the 449 US reservoirs we track fell and only 97 rose — a net loss of 18.6 km³, and a drop in weighted storage from 64.5% to 58.9% of capacity. But the national average hides the extremes, and the extremes are where the story is. Lake Corpus Christi in south Texas gained 80.3 points in three months, going from 11.2% to 91.5% — the highest reading in our four-year record for it, reached from a low set the same spring. At the other end, Jackson Lake in Wyoming gave up 49.4 points and 516 hm³ (418,000 acre-feet), falling from 94.3% to 44.9% in a window when it more often fills. These are the ten reservoirs that moved furthest, and why each one moved.
Key takeaways
- The summer was lopsided. Across 449 reservoirs, 313 fell and 97 rose in the 90 days to mid-August. Weighted storage went from 64.5% to 58.9%, a net 18.6 km³ gone from a monitored capacity of 332 km³.
- Lake Corpus Christi is the single biggest riser in the country — 11.2% to 91.5%, +255 hm³ (207,000 acre-feet). In each of the three previous years it fell across this same window, by 2, 1 and 23 points.
- Jackson Lake is the biggest faller relative to its own history — 44.9% against 82.3% on the same date in 2025 and a 69.3% August normal.
- American Falls lost more water than any other reservoir: 1,090 hm³ (884,000 acre-feet) in 90 days. Yet it drew down less steeply than it usually does — a reminder that the biggest number is not always the biggest anomaly.
- The direction of travel is regional, not random. Oregon reservoirs fell 36.0 points on average, Idaho 28.8 and Washington 27.5, while Kentucky rose 7.8 and Tennessee 4.7.
How we ranked them
Raw change is a poor way to rank reservoirs, because most large summer movements are simply the calendar. An irrigation reservoir in the interior West is supposed to fall 40 points between May and August; a flood-control pool in Kansas is supposed to fill in spring and bleed off through summer. Ranking on the raw number surfaces the reservoirs with the most dramatic operating schedules, not the ones behaving unusually.
So every reservoir below is measured twice. First the actual move over the 90 days to mid-August. Then the same calendar window in each prior year we hold data for, which gives that reservoir's own normal. The gap between the two — what we call the anomaly — is what tells you whether anything happened. Cle Elum in Washington fell 74.5 points this summer, a spectacular-looking number that does not appear in this list: it falls about 48 points in an average year, and at 25.2% it is sitting almost exactly on its August normal of 24.2%. That is a reservoir doing its job, not a reservoir in trouble.
Two exclusions are worth stating. Reservoirs already near empty at the start of the window are left out of the risers, because "fell less than usual" is arithmetic rather than recovery. And Green Mountain in Colorado was dropped after its record showed a single-day spike to 44.9% on 28 July sitting between neighbouring readings of 22.2% and 20.5% — a bad reading rather than a real event.
The five biggest risers
1. Lake Corpus Christi, Texas: 11.2% → 91.5%
Lake Corpus Christi did something no other reservoir in the dataset came close to. It began the window at 11.2%, having bottomed at 8.5% on 18 April — 27 hm³ of water in a reservoir built for 317 — and finished at 91.5%, holding 290 hm³. That is a gain of 255 hm³, or roughly 207,000 acre-feet, and it is the highest level in the four years of daily USGS readings we hold for it. The refill came in two distinct pulses: a slow climb from late May that carried it to about 35% by early July, then a violent one in the first week of August, when it went from 42.2% on 1 August to 86.3% on the 7th. The seasonal context is what makes it remarkable rather than merely large — across the same mid-May to mid-August window, this reservoir fell in 2023, 2024 and 2025. On this date last year it was 18.4% full.
2. Bull Lake, Wyoming: 37.6% → 74.9%
Bull Lake is the exception that makes the western picture legible. While the interior West emptied, this 188 hm³ Bureau of Reclamation reservoir on the Wind River filled from 37.6% to a peak of 82.9% on 31 July, and has eased back to 74.9% since. The gain of 37.3 points is worth 70 hm³ (57,000 acre-feet). Bull Lake does normally fill across this window — snowmelt reservoirs do — but it normally gains about 16 points, not 37. It now sits above its August average of 70.3% and well above the 37.2% it held on this date in 2025. The trajectory is smooth, with no single day moving it more than 1.5 points, which is the signature of melt rather than a storm.
3. Medina Lake, Texas: 3.8% → 29.9%
Medina Lake had been effectively dead for years. It sat at 3.8% through the whole of spring — 12 hm³ in a 314 hm³ reservoir — and its August average across our record is just 8%. It is now at 29.9%, the highest reading we hold for it, having gained 26.1 points and 82 hm³ (66,000 acre-feet). The recovery arrived in two steps, one around 20 June and a larger one on 15 July that added 9.6 points in a single day. The caveat matters as much as the number: 29.9% is a four-year record for Medina and still means the reservoir is seven-tenths empty. This is a reservoir returning from the dead, not a reservoir that is full.
4. Kanopolis Lake, Kansas: 72.9% → 95.1%
Kanopolis is the clearest sign that the wet weather this summer sat over the central plains rather than the mountains. The lake climbed from 72.9% in mid-May to its flood pool, holding 105% from mid-June to mid-July, and has receded to 95.1%. The 22.2-point net gain is modest in volume terms — 17 hm³ in a 76 hm³ reservoir — but it stands against a normal move of about 5 points for this window, and it leaves Kanopolis 12 points above its August average of 83.1%. Readings above 100% are not errors here: capacity is measured against the conservation pool, so a flood-control lake deliberately holding storm water reads over 100.
5. Choke Canyon, Texas: 6.8% → 22.7%
Choke Canyon more than tripled, from 6.8% to 22.7%, and because it is the largest of the Texas movers at 881 hm³ of capacity, that modest-sounding percentage is worth 140 hm³ — 114,000 acre-feet, the fourth-largest volume gain in the country. Almost all of it arrived at once: the reservoir sat between 7% and 8% from April until 23 July, then jumped to 21% within two days and has held there since. But Choke Canyon is the one riser on this list that is still below where it should be. Its August average is 26.6%, so even after tripling it remains about four points short of normal — and its own record high, 35% in September 2022, is a level it has not approached since.
The five biggest fallers
6. Jackson Lake, Wyoming: 94.3% → 44.9%
Jackson Lake is the most serious decline in the dataset, and the cleanest to interpret. It peaked at 96.8% on 20 May and has fallen without interruption since, reaching 44.9% — a loss of 49.4 points and 516 hm³, or 418,000 acre-feet. Every comparison points the same way: it held 82.3% on this date in 2025, its August average is 69.3%, and in two of the four prior years it actually gained across this window. At 1,045 hm³ this is one of the larger reservoirs in the interior West, and it sits at the head of the Snake River system, so its level is a leading indicator for irrigators downstream in Idaho. Our August survey of US reservoirs found the same reservoir down 33 points year-on-year — this is not a one-week wobble.
7. Pine Flat Lake, California: 105% → 28.6%
Pine Flat posted the largest percentage swing of any faller. It was at 105% — full into the flood pool — as late as 26 May, and has since drained steadily to 28.6%, giving up 76.4 points and 809 hm³ (656,000 acre-feet), the second-largest volume loss in the country. On the Kings River above Fresno, Pine Flat is run hard for irrigation, so a summer decline is expected; its normal for this window is about 28 points. Falling 76 is not. The reservoir now sits nearly 25 points below its August average of 53.1%, and below the 34.6% it held a year ago. Nothing in the daily record suggests an event — the steepest single day moved it 1.4 points — which points to sustained heavy releases rather than a sudden call on the water.
8. Pineview Reservoir, Utah: 86.9% → 27.7%
Pineview, above Ogden, ran down from 86.9% to 27.7% in a straight line, losing 59.2 points and 80 hm³ (65,000 acre-feet) from a 136 hm³ reservoir. Its normal loss over this window is around 12 points, so this is roughly five times the usual drawdown. It now sits almost 35 points below its August average of 62.4% and nearly 40 points below the 67.4% it held on the same date last year. Utah as a whole fell 23.7 points on average across the summer and is at 47.2% full, but Pineview is the sharpest single decline in the state and the third-largest anomaly in the country.
9. Vallecito Reservoir, Colorado: 88.9% → 35.4%
Vallecito, on the Los Piños in the San Juan mountains, fell from 88.9% to 35.4% — 53.5 points and 86 hm³ (69,000 acre-feet) out of a 160 hm³ reservoir. It is the largest of a cluster in south-west Colorado all moving the same way: Lemon nearby fell 56.2 points to 32.1%, and Silver Jack 43.2 points to 11.8%. That clustering is what distinguishes a basin-wide snowpack shortfall from a local operating decision. Vallecito is now 21 points below its August average and 13 points below where it stood a year ago, and Colorado reservoirs averaged a 18.2-point fall across the summer.
10. American Falls, Idaho: 65.8% → 12.9%
American Falls lost 1,090 hm³ — 884,000 acre-feet — more water than any other reservoir in the country over these 90 days, ending the window at 12.9% of its 2,062 hm³ capacity. It belongs on this list for that reason alone. But it also carries the most instructive caveat: measured against its own history, this was a gentler summer than usual. American Falls typically sheds around 63 points across this window and this year shed 53. The reservoir is low because it started low — 65.8% in mid-May, against the 80%-plus it reached in April — and because it is drawn down to near-empty most Augusts, with an August average of 23.3%. The problem on the upper Snake is not this summer's releases; it is that the reservoir had less to work with when the season began.
What the ten have in common
Split geographically, the list resolves into two weather stories. Every riser is in Texas or the central plains, where a series of summer rain events landed between mid-June and early August; every faller is in the interior West or California, where the reservoirs are working through a thin snowpack. The state averages say the same thing in aggregate: Oregon down 36.0 points, Idaho down 28.8, Washington down 27.5, Utah down 23.7 and Nevada down 22.2, against Kentucky up 7.8 and Tennessee up 4.7.
It is worth being careful about cause. We can see precisely when each reservoir moved and by how much, because we hold the daily readings; we have not matched those dates against rainfall records or storm tracks, so the attribution above is inference from the shape and timing of the curves, not a meteorological finding. What the data does support without qualification is the asymmetry. The five risers on this list gained 0.56 km³ between them; the five fallers gave up 2.58 km³ — more than four times as much. Widen it to every reservoir we track and the gap holds: the 97 that rose added 2.86 km³ between them, while the 313 that fell gave up 21.37 km³.