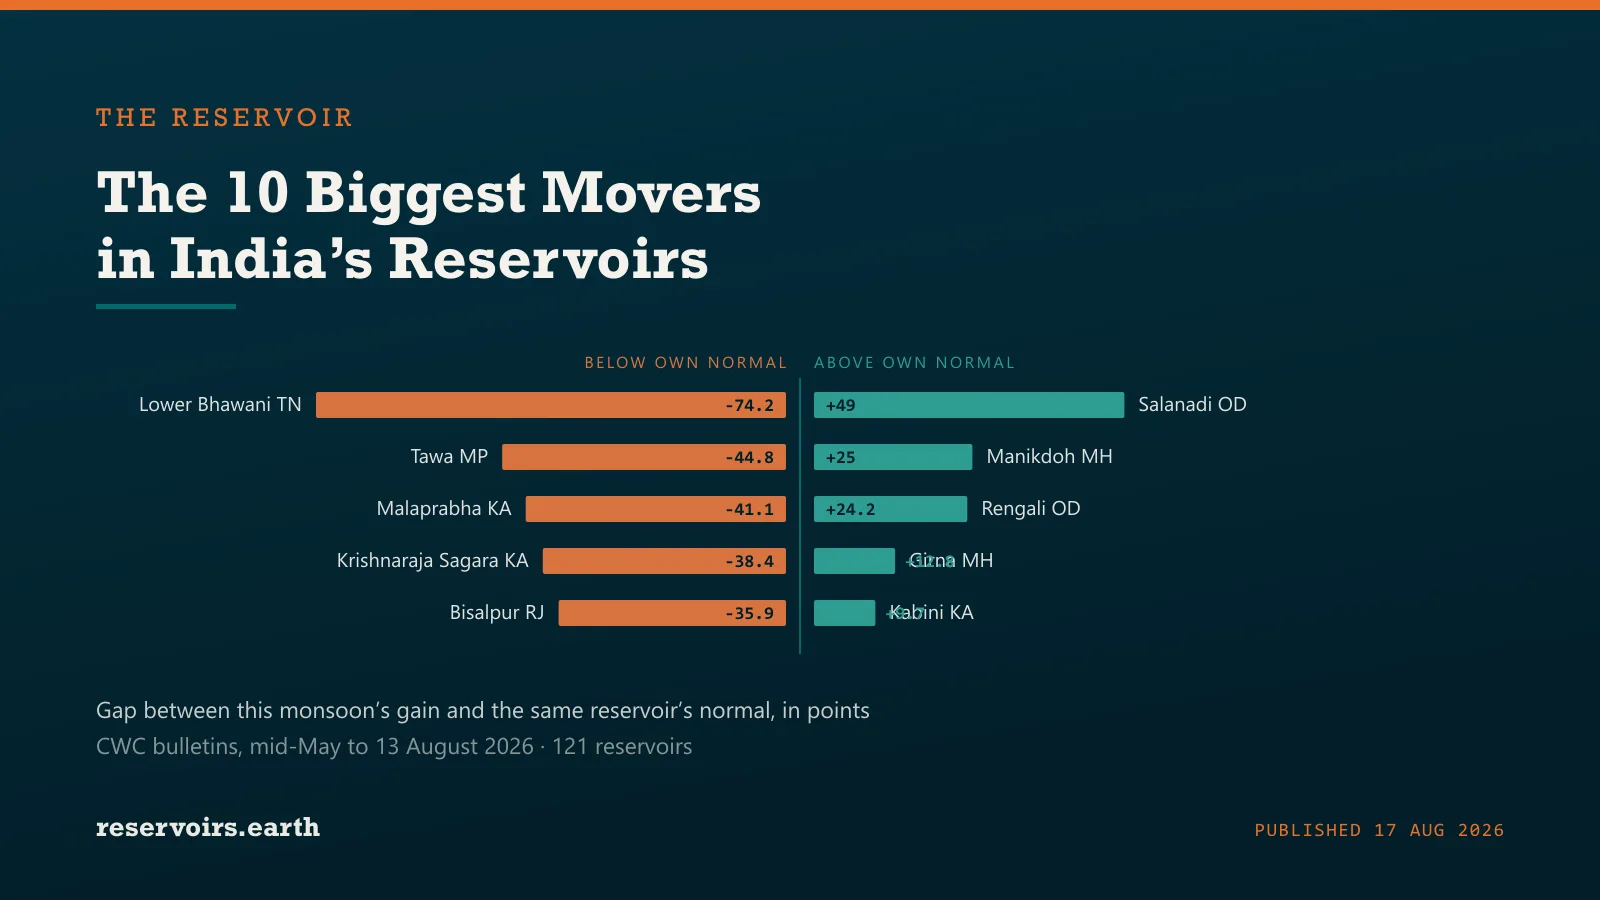
Between mid-May and mid-August 2026, 88 of the 121 Indian reservoirs we can track through the monsoon rose and 25 fell, adding a net 27.5 km³. But in a monsoon almost everything rises, so the raw gain says very little. Measured against what each reservoir normally does across these same three months, 68 of the 93 with a usable baseline are running below their own normal — an average shortfall of 11.0 points. Rengali in Odisha gained the most water in the country, 2,475 hm³, climbing from 14.2% to 76.8%. Lower Bhawani in Tamil Nadu is the most striking failure: it normally gains 72 points across this window, and this year it gained nothing at all. These are the ten reservoirs that moved furthest from their own normal, and why each one did.
Key takeaways
- Rengali is the biggest gainer in absolute terms — 2,475 hm³ added, from 14.2% to 76.8%, having bottomed near empty in early July.
- Lower Bhawani is the biggest miss in the country. It ended the window at 24.1%, essentially where it started. It reached 100% by this date in 2025 and 91% in 2024.
- Bisalpur, which supplies Jaipur, has not filled. It sits at 68.7%, below where it started in May, against 98.4% on this date last year.
- The monsoon has been generous in the east and thin in the centre and north. Odisha is the only state averaging above its own normal, at +8.9 points; Uttar Pradesh runs at −25.1, Madhya Pradesh at −21.3 and Karnataka at −19.2.
- Indira Sagar, India's largest reservoir, gained 1,579 hm³ and is still badly short — 35.1% against 64.0% a year ago, and 24 points below its own normal gain for the window.
How we ranked them
Ranking Indian reservoirs by raw change during a monsoon produces a list of the reservoirs with the largest catchments, which is not news. Nearly everything fills between May and August; the question is whether it filled as much as it should have.
So each reservoir is measured twice. First the actual move over the 90 days to mid-August. Then the same calendar window in each prior year we hold Central Water Commission data for, which gives that reservoir its own normal. The gap between the two is what we rank on. It is why Kabini appears here having gained 70 points while Bhatghar, which gained 83, does not: Bhatghar gains about 90 points in an average year, so this was a slightly disappointing monsoon for it, not a remarkable one.
A consequence worth stating plainly: in the fallers below, most reservoirs did gain water. They are on the list because they gained far less than they normally do. Only three of the ten actually finished lower than they started.
Three exclusions. Twelve reservoirs are set aside because their readings exceed our stored capacity — Linganamakki reached 269.5% last August, which means our capacity figure for it is wrong rather than that the dam held two and a half times its own volume. The 31 May 2026 bulletin is dropped: it reports the national basket 14 points above both the reading before it and the reading after it, six days apart, which is not physically possible. And Upper Tapi in Maharashtra is excluded after its record showed a 49-point jump in the week to 29 May — before the monsoon reached it — followed by an immediate reversal.
Note that India's baselines are shorter than we would like. CWC data in our seed begins in June 2023, so most reservoirs here are measured against two prior years, not four.
The five biggest risers
1. Salanadi, Odisha: 60.4% → 99.6%
Salanadi is the largest anomaly in the dataset, and it is an anomaly precisely because this reservoir does not normally fill in the monsoon at all. Across this window it lost 2 points in 2025 and 18 points in 2024; this year it gained 39.2 points, adding 219 hm³ to reach 99.6% — effectively full. The gain arrived in a single week, jumping from 61% on 16 July to 100% on 23 July, and it has held there for the four bulletins since. At 558 hm³ it is a modest reservoir in national terms, but a small dam in the Baitarani basin going from steady to spilling in seven days is the clearest single signature of where this monsoon actually delivered.
2. Manikdoh, Maharashtra: 6.6% → 76.4%
Manikdoh spent the entire pre-monsoon at or below 7%, bottoming at 4% in late June — a 288 hm³ reservoir in the Kukadi system holding barely 12 hm³ of water. It then filled in six weeks: 33% by 9 July, 55% by 30 July, 76.4% now. The 69.8-point gain is 25 points more than its own normal, and it stands well clear of the 43.1% it held on this date last year. Among the Maharashtra dams this is the sharpest recovery from a genuinely critical starting point.
3. Rengali, Odisha: 14.2% → 76.8%
Rengali on the Brahmani added 2,475 hm³ — more water than any other reservoir in India over these 90 days — and it did so from almost nothing. It fell to 1% on 25 June and 0% on 2 July, then climbed 5%, 14%, 27%, 57%, 72% and 76.8% in consecutive weekly bulletins. The single week to 30 July added 30 points, close to 1,200 hm³. Against a normal gain of 38.4 points it is running 24 points ahead, and it now holds more than the 67.1% it held a year ago. At 3,956 hm³ this is one of the larger reservoirs in eastern India, and it is the main reason Odisha is the only state in the country averaging above its seasonal normal.
4. Girna, Maharashtra: 11.1% → 34.2%
Girna is a more modest entry and a useful corrective to the others. It added 351 hm³ and 23.2 points — roughly double its normal gain of 10.4 — and yet it finishes the window at just 34.2% full. In 2024 it reached only 14% by this date, and in 2025 only 22.7%, so this is comfortably its best monsoon of the three. A reservoir can be well above its own normal and still be two-thirds empty, and Girna is what that looks like.
5. Kabini, Karnataka: 9.6% → 79.8%
Kabini is the one Karnataka dam on the riser side of this list, and it stands out sharply against its neighbours. It bottomed at 3% on 4 June, then gained 70.1 points to reach 79.8%, about 10 points more than its normal for the window. That matters because the rest of the Cauvery system did not do this: Krishnaraja Sagara downstream is 38 points below its own normal, and Malaprabha and Bhadra are both far short. Kabini draws from the Wayanad hills in Kerala rather than the Karnataka plateau, and this monsoon the difference between those two catchments has been decisive.
The five biggest fallers
6. Lower Bhawani, Tamil Nadu: 25.8% → 24.1%
Lower Bhawani is the most extreme result in the dataset by a wide margin. This 792 hm³ reservoir in the Cauvery basin normally gains 72.5 points across these three months — it gained 63 in 2025 and 82 in 2024, finishing at 100% and 91% respectively. This year it gained nothing: it started the window at 25.8%, drifted down to 19% in early July, and is at 24.1% now. Its anomaly of −74.2 points is nearly twice that of any other reservoir here. Nothing in the daily record suggests a data problem; the reservoir simply never received its monsoon.
7. Tawa, Madhya Pradesh: 16.1% → 36.5%
Tawa, on a Narmada tributary, did gain — 20.4 points and 411 hm³ — but its normal for this window is 65.2 points, and in both prior years it finished at 85%. It is at 36.5%. The shape of the failure is visible in the weekly record: where 2025 went from 15% on 26 June to 64% by 11 July, this year the equivalent fortnight moved it from 4% to 7%. The recovery only began in August, which added 13.8 points in the final week alone — real improvement, but far too late to make up a two-month deficit.
8. Malaprabha, Karnataka: 7.3% → 39.3%
Malaprabha in the Krishna basin gained 32 points against a normal of 73.1. In 2025 it was at 81% by this date and in 2024 at 85%; it is at 39.3%. Like Tawa, it lost its monsoon in the first half: it was still at 5% on 25 June and 4% on 2 July, by which point in a normal year it would already be filling hard. The 1,018 hm³ reservoir supplies irrigation across Belagavi district, and at under 40% going into the second half of August it has limited room to recover before the rains withdraw.
9. Krishnaraja Sagara, Karnataka: 15.3% → 47.7%
Krishnaraja Sagara — the KRS dam above Mysuru, one of the most closely watched reservoirs in southern India — gained 32.4 points against a normal of 70.8. It reached 83.6% by this date in 2025 and 84% in 2024; it is at 47.7% now. Its position is better than Malaprabha's and improving quickly, with 30 points added in the final fortnight, but it remains 38 points below its own normal. KRS and Kabini share the Cauvery system and have had opposite monsoons, which makes the contrast between the two the single most useful thing in this list for anyone following Karnataka's water.
10. Bisalpur, Rajasthan: 73.4% → 68.7%
Bisalpur is the entry with the most direct consequences for a city. It is the principal water source for Jaipur, and it has spent the entire monsoon flat: 73.4% in mid-May, a slow decline to 65% through July, and 68.7% now — a net loss of 4.7 points where it normally gains 31.2. On this date in 2025 it stood at 98.4%. The reservoir is not in a critical state in absolute terms, and it is far better off than Malaprabha or Lower Bhawani, but a supply reservoir that ends the monsoon 30 points below last year enters the dry season with much less margin than usual.
What the ten have in common
Split geographically, the list resolves cleanly. Both of the largest anomalous gains are in Odisha, the only state averaging above its own normal at +8.9 points. Every faller is in the centre, south or north-west: Uttar Pradesh averages −25.1 points against its normal, Madhya Pradesh −21.3, Karnataka −19.2 and Rajasthan −14.5. Maharashtra, with 25 reservoirs in the sample, sits closest to normal at −4.7.
One reservoir deserves mention despite finishing outside the ten. Indira Sagar on the Narmada, at 12,221 hm³ the largest reservoir in the country, added 1,579 hm³ — the sixth-largest gain in India — and is nonetheless 24 points below its own normal, at 35.1% against 64.0% a year ago. Because of its size, that single shortfall is worth more water than the combined gains of every riser on this list except Rengali. Rankings by anomaly reward the dramatic; the largest reservoirs move the national total.
A word on what this analysis cannot tell you. We hold the weekly bulletins, so we know precisely when each reservoir moved and by how much. We have not matched those dates against rainfall records or monsoon-progression data, so the catchment explanations above are inference from the timing and shape of the curves, not a meteorological finding.