
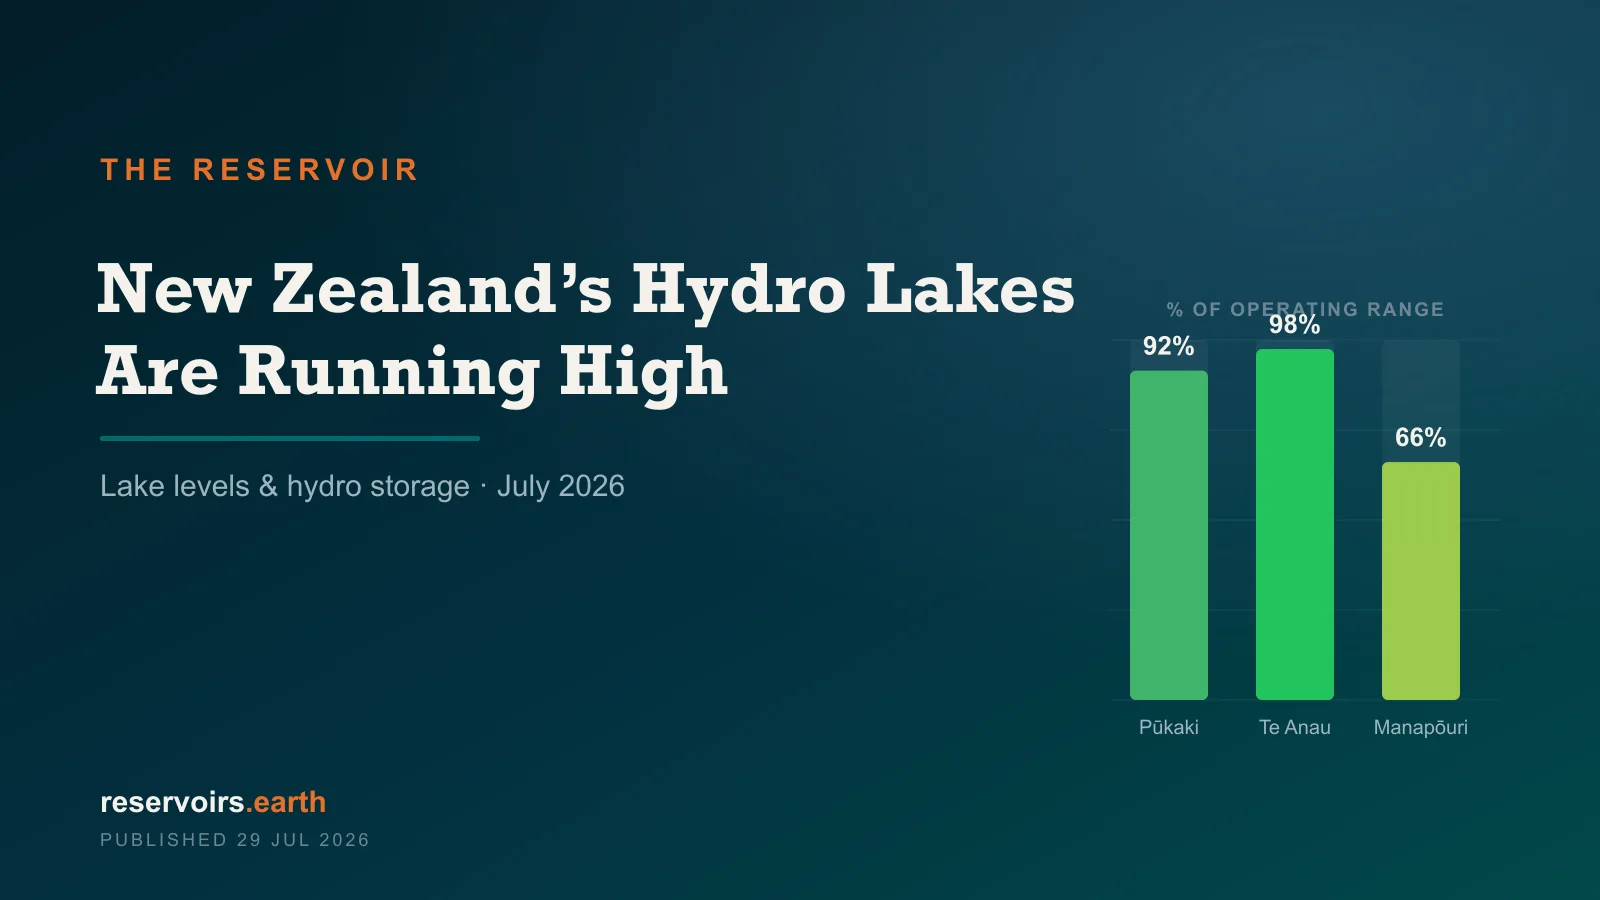
New Zealand's hydro lakes are running well above normal for late winter. As of the week of 27 July 2026, Lake Te Anau sits at 202.67 m — effectively the top of its consented operating range — and Lake Pūkaki, the country's largest single store, is at 531.27 m, about 91% of its operating range. Nationally, hydro storage is running roughly 28% above its 93-year average for the time of year, with the South Island — where almost all of New Zealand's controllable storage sits — about 43% above normal. Because New Zealand reports its lakes as stored electricity rather than water, these are, in effect, the charge level of the country's largest battery. Live figures for every lake and island are on the New Zealand page.
Key takeaways
- New Zealand's hydro storage is well above average for late July — around 28% above the 93-year seasonal norm nationally, and about 43% above normal in the South Island, which holds the great majority of the country's controllable storage. Live data on the New Zealand page.
- The big southern lakes are near the top of their operating ranges. Te Anau is at 202.67 m (
98% of its 201.5–202.7 m range) and Pūkaki at 531.27 m (91% of 518.0–532.5 m). Manapōuri is more moderate at 177.99 m (~66%). - New Zealand counts its water as energy. Storage is published in gigawatt-hours, not cubic metres, because the lakes exist to generate electricity — so a fill figure here is a share of storable power.
- Lake level and stored energy are not the same number. Pūkaki is ~91% of the way up its level range but only about halfway up its historical energy range — because stored energy falls faster than the water level as a lake draws down.
- It is a comfortable place to start the back half of winter for a grid that runs mostly on hydro — but storage is read against the seasonal norm, and late winter is still drawdown season.
Where the data comes from
New Zealand does not publish a single official "percent full" for its hydro system. What it publishes, weekly, is stored energy in gigawatt-hours (GWh) — from Meridian Energy and NZX's Comparative Hydro Storage series — alongside lake levels in metres on Meridian's lake-levels page. reservoirs.earth mirrors both: the national and island storage against the 93-year average and the full 1927–2025 range, and, for the three tracked Meridian lakes, the water level against each lake's published operating range.
Two caveats we keep in plain sight. First, the storage series is published as charts, not data tables, so the GWh figures here are read from those charts and are approximate — the lake levels in metres, by contrast, are exact published readings. Second, the timeliest per-lake storage feed in New Zealand is behind a paid subscription, so this is a weekly, free-tier picture. How we source and age this data is on the methodology page, and New Zealand's openness is scored in the Reservoir Transparency Index.
The current picture (week of 27 July 2026)
| Store | Stored energy | vs 93-yr average | Lake level (operating range) |
|---|---|---|---|
| South Island | ~3,000 GWh | +43% | — |
| North Island | ~470 GWh | +24% | — |
| Lake Pūkaki | ~1,570 GWh | +21% | 531.27 m · ~91% |
| Lake Te Anau | ~270 GWh | +29% | 202.67 m · ~98% |
| Lake Manapōuri | ~125 GWh | +14% | 177.99 m · ~66% |
| National | ~3,400 GWh | +28% | — |
Every line in that table is above its seasonal average — an unusually uniform picture. The standout is Te Anau, essentially brimming at the top of its operating range, and the South Island as a whole, ~43% above normal. The energy figures are approximate; the metre readings for the lakes are exact.
Why New Zealand measures its lakes in gigawatt-hours
Most countries report a reservoir as a share of its water capacity — how many cubic metres it holds against how many it can hold. New Zealand's public hydro figures work differently, and for a good reason: the country's grid is largely hydropower, and the big southern lakes exist first and foremost to generate electricity. So the regulator and generators report what actually matters to the power system — the energy the stored water can still produce — in gigawatt-hours.
That makes the number unusually meaningful: a percentage against the historical range is a share of storable electricity, the physical input behind winter power security. It also means there is no honest, official "100% full" to divide by — no single maintained capacity figure across all the lakes — which is why reservoirs.earth shows New Zealand storage against its 93-year average and its historical range, rather than as a capacity-based fill percentage.
Lake level vs stored energy: the same lake, two different numbers
Here is the subtlety that trips up a quick reading of the data. Lake Pūkaki is at 531.27 m — about 91% of the way up its operating range in metres. But in energy terms it sits only around the middle of its historical storage range. How can the same lake be "nearly full" and "mid-range" at once?
Because energy and water level are not linear with each other. As a lake drops, it loses volume and head — the height the water falls through the turbines. Stored energy depends on both, so it falls faster than the level does. A lake near the top of its metre range can still be well short of its energy maximum, and the last metre of level is worth more generation than the first. That is exactly why we show both figures on each lake page: the level in metres is what most people look up, while the energy in GWh is what the power system runs on — and the gap between them is the physics of a hydro lake.
What an above-average winter start means for the grid
New Zealand's reservoir calendar is a winter-drawdown system: storage is pulled down through the colder months to a late-winter low, then refills on spring inflows and snowmelt. Sitting above the seasonal average in late July means the country enters the back half of winter with more in the tank than usual — a comfortable buffer for a grid that leans on these lakes when demand peaks and the wind is calm.
We publish reservoir data, not price forecasts. But storage is the physical input the electricity market reads, and this July it reads healthy: the South Island schemes that carry most of the national store are running well above normal, and the two largest Meridian lakes are near the top of their ranges. The number to watch through August and September is not the raw level but the gap to the seasonal norm — as long as that stays positive into the spring refill, the hydro system starts the new year ahead.
What these numbers do — and don't — tell you
- The unit is energy, not water. A New Zealand fill figure is a share of storable electricity, so it should not be compared directly with the volumetric percentages of, say, Spain or the United States.
- Level and energy answer different questions. For a specific lake, the metre reading is the water level people look up; the GWh figure is what the grid can generate. They move differently — see Pūkaki.
- Timing changes the meaning. Above-average in late-winter drawdown is a good sign; the same figure at the spring peak would be ordinary. Watch the gap to the norm, not the raw number.
- The GWh figures here are approximate. They are read from a weekly chart; the per-lake metre readings are exact. Everything links back to its source on the New Zealand page.