
"Day Zero" is the day a city's reservoirs fall so low that the utility shuts the mains and rations water at collection points. The phrase was coined in Cape Town in 2017–2018, where officials defined it precisely: the day the big supply dams dropped below 13.5% of capacity, at which point most taps would be switched off and residents would queue for a rationed 25 litres per person per day. Cape Town never reached it — but since then the same countdown has run in city after city. Chennai's reservoirs fell to 0.2% full in 2019; Monterrey actually lost its taps for weeks in 2022; Montevideo started mixing salt water into the supply in 2023; Bogotá rationed water for nine million people for a full year in 2024–25. Day Zero is rarely just a weather event: in every case here, a drought met concentrated supply, fast-growing demand and leaky pipes — and the cities that escaped leaned on the same handful of known tools. This piece is the roster of who came closest, why it is happening more often, and how the next city avoids it.
Key takeaways
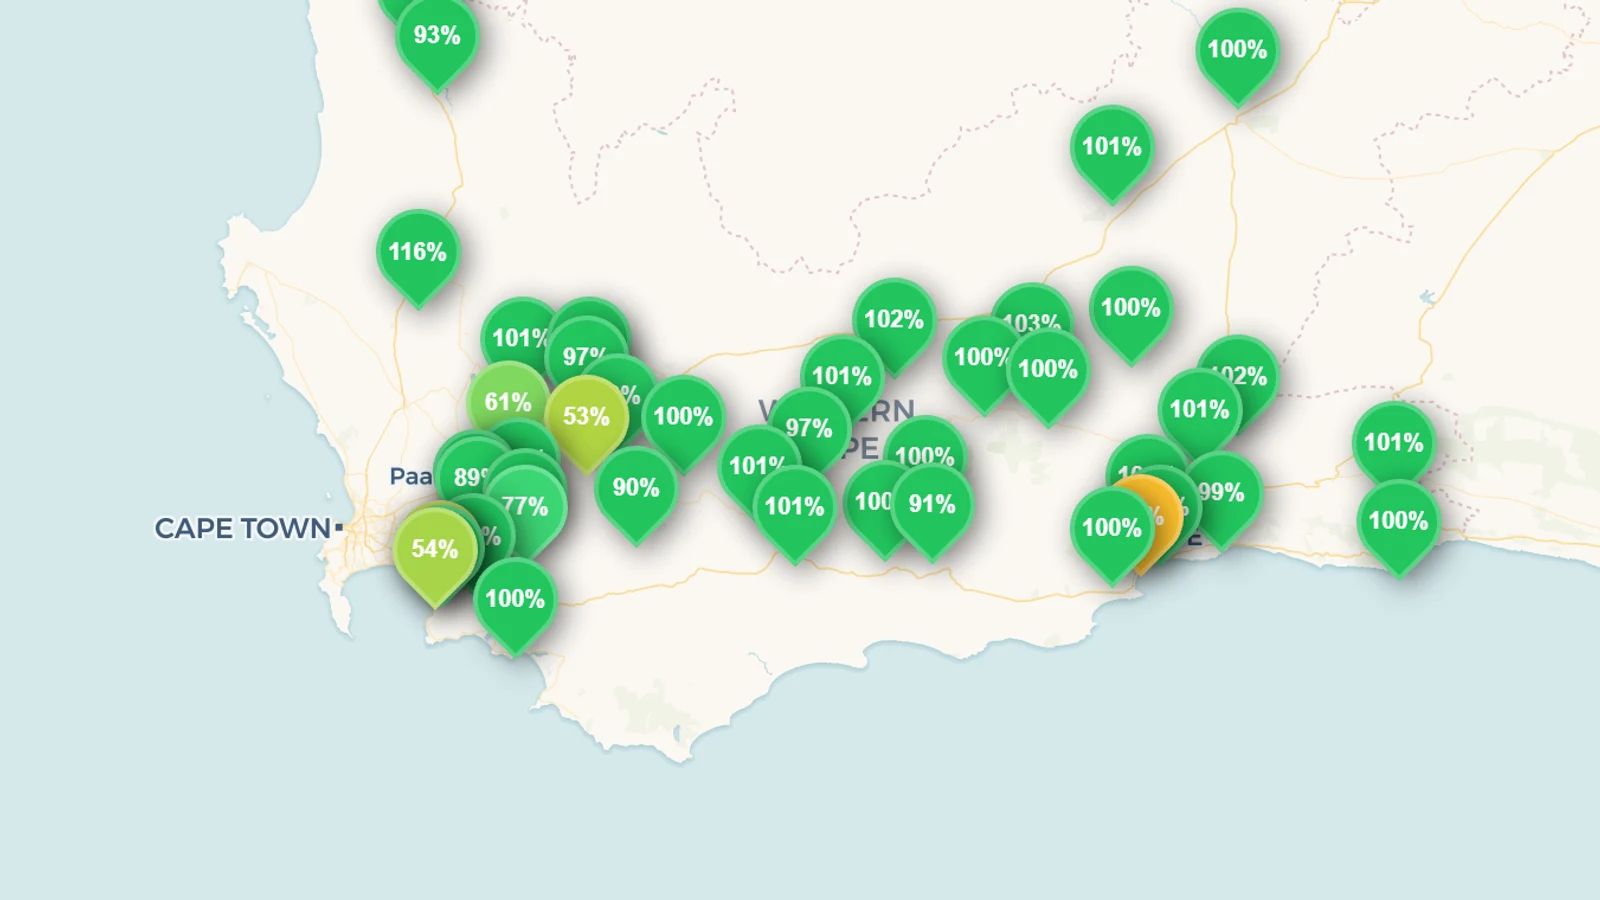
- "Day Zero" is a Cape Town invention with a hard number. The City defined it as its major dams falling below 13.5% of capacity — the threshold at which it would cut most of the mains supply (usable water sits about 10 points lower still). Cape Town's own big-six dams bottomed at 21.4% on 14 May 2018, and the largest, Theewaterskloof, hit about 10% at its April low. See how full those dams are today on the South Africa page.
- At least half a dozen major cities have since hit or nearly hit Day Zero. Chennai (2019, reservoirs ~0.2% full), São Paulo (2014–15), Monterrey (2022, taps dry for weeks), Montevideo (2023), Bogotá (2024–25) and Mexico City (2024) have all run the countdown — with very different outcomes.
- Day Zero is a demand-vs-storage failure, not just a drought. Every case combines a dry spell with over-reliance on a few surface reservoirs, fast-growing demand and leaky networks. Drought is the trigger; the exposure is built in.
- The risk is widening. WRI's Aqueduct Atlas (2023) finds 25 countries — a quarter of humanity — face extremely high water stress every year, and a peer-reviewed projection has the number of large cities facing water scarcity rising from 193 in 2016 to 292 by 2050.
- Day Zero is avoidable, and often cheaply. Cape Town averted it mainly by halving demand, not by finding new water. The durable fixes are demand management, publishing the numbers, diversifying supply through water reuse, and stopping leaks — and all of them start with being able to see the reservoir level, which is what the Reservoir Transparency Index scores.
What "Day Zero" actually means
The term was popularised by the City of Cape Town during the drought of 2015–2018, and it entered wide use in January 2018, when the City warned its roughly four million residents they were about three months from running out of municipal water. Officials gave it an exact definition: Day Zero was the day the combined level of the major supply dams would fall below 13.5% of capacity. At that point the City would trigger its disaster phase — switching off most of the mains network and rationing water to 25 litres per person per day, collected in person from distribution points across the metro.
The 13.5% threshold is not arbitrary. The last slice of a reservoir is the hardest to use: intakes sit above the bed, and the final tenth is silt-laden and difficult to abstract. Cape Town's official dam reports carry a standing note that usable water is roughly 10 percentage points below the reported dam level — so a dam reading 13.5% holds only a few percent of genuinely usable water. Day Zero, in other words, is the moment a reservoir stops being a water supply and becomes a shrinking pool of largely unusable water.
That is the mechanism behind every case below: a city that draws most of its water from a small number of surface reservoirs, a drought that empties them faster than they refill, and a level that marches toward the floor while demand barely moves. We track exactly these levels — for South Africa, the Department of Water and Sanitation's weekly dam-level bulletin covers about 218 dams.
The cities that hit or nearly hit Day Zero
Since Cape Town, the countdown has run in cities across four continents. The outcomes range from "averted with room to spare" to "taps dry for weeks."
| City | Year | Reservoir low point | What people experienced |
|---|---|---|---|
| Cape Town, South Africa | 2018 | Big-six dams 21.4%; Theewaterskloof ~10% | Averted — taps never shut; demand halved |
| Chennai, India | 2019 | Four main reservoirs ~0.2% | Near-dry; >10 million on tankers and water trains |
| São Paulo, Brazil | 2014–15 | Cantareira system ~5% of useful volume | Averted — city pumped the reservoir's "dead volume" |
| Monterrey, Mexico | 2022 | Cerro Prieto dam ~0.5% | Taps ran dry — supply cut to ~6 hours a day for weeks |
| Montevideo, Uruguay | 2023 | Paso Severino ~2.4% | Water kept flowing, but salty — brackish river water blended in |
| Bogotá, Colombia | 2024–25 | Chingaza system <17% | Rotating rationing for ~9 million for about a year |
| Mexico City, Mexico | 2024 | Cutzamala system ~26% | Feared "Day Zero" (26 June) — disputed by officials, and averted |
| Bengaluru, India | 2024 | ~6,900 of 13,900 borewells dry | Groundwater and tanker crisis, not a single-reservoir Day Zero |
Cape Town, 2018 — the one that named it, and dodged it
Cape Town projected Day Zero for 21–22 April 2018, then revised it forward to 12 April as the dams kept falling. It never happened. On 7 March 2018 the City announced Day Zero was off for the year — helped by a roughly 10-gigalitre release of surplus water donated by commercial farmers — and on 28 June 2018 it postponed the date indefinitely. The rescue was near-normal winter rains combined with a demand cut of more than half: daily municipal use fell from a pre-drought peak of about 1,200 million litres a day (February 2015) to about 511 million on 12 March 2018. July's rainfall was actually below average, which is the point worth holding onto — conservation, not an exceptional rain year, is what bought the time.
Chennai, 2019 — reservoirs at 0.2%
Chennai draws on four main reservoirs — Poondi, Cholavaram, Red Hills and Chembarambakkam — with a combined capacity of about 11,057 million cubic feet. By 21 June 2019, after two years of failed monsoons, they held about 0.2% of that between them, with three of the four completely empty. More than 10 million people across the metropolitan area were left dependent on tanker trucks and, from July, a dedicated water train. "Day Zero" here was a label borrowed by international media rather than an official declaration — but the reservoirs really were dry.
Monterrey, 2022 — the taps that actually failed
Monterrey is the clearest real-world tap failure on the list. The Cerro Prieto dam fell to about 0.5% of capacity and stopped supplying the metropolitan area on 15 July 2022, the first such failure since it opened in 1984. Through June, authorities had already limited supply to roughly six hours a day, and many neighbourhoods went weeks with no piped water at all, queuing at tanker trucks. This was Day Zero in all but the name.
Montevideo, 2023 — when the water turned salty
Uruguay declared a water emergency for greater Montevideo on 19 June 2023 during its worst drought in over 70 years. The main Paso Severino reservoir fell to about 2.4% of its ~67-million-cubic-metre capacity. Rather than cut supply, the utility blended brackish water from the Río de la Plata estuary into the system from late April, so taps kept running — but saltier. Authorities raised the sodium limit to 440 mg/L, advised pregnant women and people with hypertension or kidney disease to avoid tap water, and handed out bottled water. A Day Zero of quality rather than quantity.
Bogotá, 2024–25 — a year of rationing
Bogotá ran the longest rationing of any city here. It began on 11 April 2024, dividing the capital and neighbouring towns into nine zones, each losing tap water for 24 hours on a rotating cycle — affecting about nine million people. The Chingaza system, which supplies roughly 70% of the city's water, had dropped below 17% of capacity. Rationing was only lifted on 12 April 2025, after what the mayor called "the worst drought in Bogotá's history."
São Paulo (2014–15) and Mexico City (2024) — the near-misses
Both of Latin America's biggest metros ran the countdown and stopped short. São Paulo's Cantareira system fell to about 5% of its useful volume in October 2014, and the utility resorted to pumping the reservoirs' "dead volume" — water stored below the intake gates — while drawing up a rationing plan of five days off and two days on that it never had to implement. Mexico City's Cutzamala system hit a historic low of about 26% in June 2024, and a widely reported "Day Zero" of 26 June — derived from an official scenario model — never arrived; officials disputed the date, and because Cutzamala supplies only a quarter to a third of the metro's water, no single reservoir could dry the whole city.
Bengaluru, 2024 — a different kind of crisis
Bengaluru's early-2024 emergency is on the list with an asterisk. India's tech capital has no Cape Town-style storage reservoir; it draws on the distant Cauvery River and on groundwater. Its crisis was one of depleted borewells — about 6,900 of the city's 13,900 wells had run dry by March 2024 — compounded by a weak 2023 monsoon that lowered the Cauvery-basin dams. It is a warning that Day Zero has a groundwater twin, and that cities leaning on aquifers are exposed in a way a reservoir gauge alone won't show.
Why Day Zero is becoming more common
None of these cities was simply unlucky. Day Zero is manufactured by four structural conditions that a drought then triggers:
- Concentrated supply. A city that draws most of its water from a handful of surface reservoirs has all its eggs in one rainfall basket. Cape Town, Chennai, Monterrey and Bogotá all fit the pattern.
- Demand that outgrows the system. Urban populations and water use keep climbing while storage is fixed, so the buffer between "full" and "empty" shrinks every year.
- Leaky, ageing networks. Water lost to leaks never reaches a tap. The World Bank estimates about 32 billion cubic metres of treated water leak away worldwide each year — a hidden drought running under every city.
- A more variable climate. Deeper, longer droughts empty reservoirs faster than the historical record says they should, so plans built on the old averages fail.
The scale of exposure is large and growing. WRI's Aqueduct Water Risk Atlas (2023) finds that 25 countries — home to a quarter of the world's population — face extremely high water stress every year, using up almost all of their available supply, and that around 4 billion people face high water stress for at least one month a year.
Who is at risk next
The honest answer is a scale, not a schedule. Naming "the next Cape Town" is guesswork, and we won't do it. What credible projections do support is a direction: a peer-reviewed study in Nature Communications (He et al., 2021) projects that the number of large cities (over a million people) facing water scarcity will rise from 193 in 2016 to 292 by 2050 — more than half of the large cities it assessed — with the number of affected megacities climbing from 9 to 19. The urban population living in water-scarce regions is projected to roughly double, to about two billion, with India's water-scarce urban population growing fastest.
That is the useful way to read the risk: not a list of doomed cities, but a rising baseline in which any city with concentrated supply, growing demand and a bad drought year can find itself running the countdown. Which is why the response matters more than the ranking.
How to avoid Day Zero: the playbook
Every city that has escaped Day Zero used some combination of four levers — and the order matters, because the cheapest and fastest come first.
1. Cut demand — it is the fastest water there is. The single intervention most credited with saving Cape Town was not new supply or rain; it was halving consumption through restrictions, punitive tariffs on heavy users, pressure management and relentless public messaging. Demand management buys the one thing a drying reservoir cannot: time to reach the next rains. It is available to every city, and it works in weeks, not years.
2. Publish the numbers — transparency is a tool, not a report. In January 2018 Cape Town launched a public "Water Map" that plotted a colour-coded dot on every household by its consumption, turning private usage into visible peer pressure; by May the City had awarded "green dot" status to about 400,000 water-saving households. The deeper principle is that you cannot manage, or panic-proof, a reservoir the public cannot see. Open, current reservoir data is an early-warning system that catches a drawdown while there is still time to act — the argument we make in full in why reservoir data must be public, and the reason the Reservoir Transparency Index exists.
3. Diversify supply away from rainfall. The structural fix is to add water that does not depend on this year's weather — recycled water, desalination and managed aquifer recharge. Orange County's Groundwater Replenishment System purifies up to 130 million gallons a day of wastewater into drinking supply for about a million people, and Singapore's NEWater meets close to 40% of national demand. A city with a drought-independent source in its mix does not run the countdown the same way. We cover this shift — and why it beats building another dam — in water reuse and fewer new reservoirs.
4. Stop the leaks. Non-revenue water — treated water lost to leaks and theft before it reaches a customer — is often the biggest, cheapest reservoir a city has. The World Bank estimates halving losses in the developing world alone could supply around 90 million more people with no new dam at all.
The bottom line
Day Zero is a management failure dressed as a weather event. The drought is real, but the countdown is built from choices — how concentrated the supply is, how fast demand is allowed to grow, how much leaks away, and whether anyone is watching the level fall in time to act. Cape Town proved the escape is cheap and fast: it halved its water use and reached the rains. Every lever that saves a city — cutting demand, publishing the data, diversifying supply, fixing leaks — depends first on seeing the number, on knowing how full the reservoirs are before they hit the floor. That is the whole reason this site exists: you can watch the levels for South Africa, India and Brazil, and see which governments even let you look on the Reservoir Transparency Index.
Sources: Cape Town figures — City of Cape Town water reports, NASA Earth Observatory, and contemporaneous South African reporting. Chennai — NASA Earth Observatory and WRI. São Paulo — Circle of Blue and academic reviews of the Cantareira crisis. Monterrey and Montevideo — NASA Earth Observatory, NPR and government emergency decrees. Bogotá — City of Bogotá and CNN. Mexico City — Conagua/OCAVM scenario modelling as reported by Mexican and international outlets. Water-stress projections — WRI Aqueduct Water Risk Atlas (2023) and He et al., "Future global urban water scarcity and potential solutions," Nature Communications (2021). Reuse and leakage — Orange County Water District, Singapore's PUB, and the World Bank. Live reservoir levels are our own, from the sources documented in how we get our data.