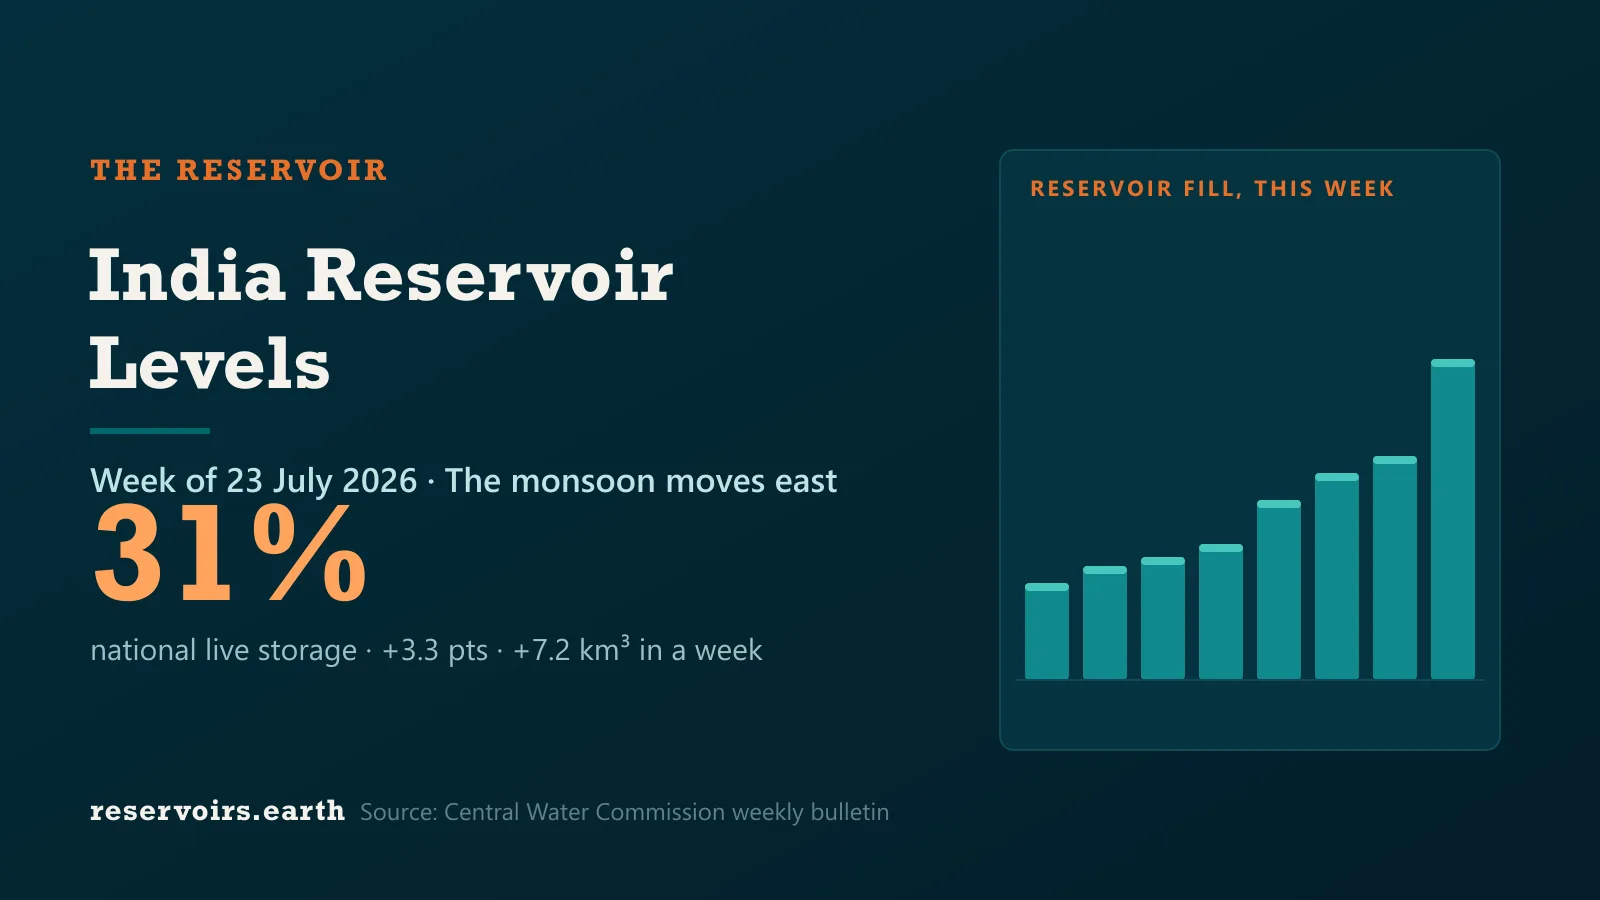
India's tracked reservoirs added 7.2 km³ of water in the fourth week of July — a slower, broader second wave of monsoon recharge after the Western Ghats surge of the previous week. Across the 149 reservoirs the Central Water Commission's weekly bulletin covered on both July 16 and July 23, combined live storage rose from 61,042 to 68,246 million m³, lifting the same-set fill from 27.9% to 31.2%. Where last week the gains were concentrated in Maharashtra's Pune-area dams, this week the monsoon band did its clearest work in the east and centre: Hirakud in Odisha jumped 30% → 41%, Hasdeo Bango in Chhattisgarh 59% → 73%, and Rihand on the Uttar Pradesh–Madhya Pradesh border ticked up for the first time in weeks. 88 of the 149 reservoirs rose; 31 fell. The one region still going backwards is the southern Krishna basin, where Nagarjuna Sagar sits at 3.2% of live storage — the emptiest big reservoir in the country. Live figures for every dam are on the India page.
Key takeaways
- +7,204 million m³ in one week (July 16 → July 23, 2026). Same-source CWC readings across an identical 149-reservoir set; combined fill rose 27.9% → 31.2%. Live data on the India page.
- 88 reservoirs rose, 31 fell, 30 held flat. The refill moved east: Maharashtra's tracked set added +8.4 points of weighted fill, Chhattisgarh +7.9, Odisha +7.8, Karnataka +6.7.
- The eastern giants turned this week. Hirakud 30% → 41%, Hasdeo Bango 59% → 73%, Panchet Hill 47% → 73% — the Mahanadi and Damodar catchments finally converting rain into storage.
- The south is still emptying. Andhra Pradesh's tracked set slipped −2.1 points and Telangana was flat; Nagarjuna Sagar (3.2%), Srisailam (17.9%) and Somasila (falling) show the monsoon band has not yet reached the Krishna headwaters.
- 31% full is a recovering but still-low level. Two consecutive strong weeks have lifted national storage roughly ten points off the pre-monsoon floor, but the filling season runs to the end of September — this is a mid-refill snapshot, not a full recovery. See our July status report for the season context.
Where the data comes from — and how we compare weeks honestly
Both readings in every comparison below come from the same source: the Central Water Commission's weekly Reservoir Storage Bulletin (July 16 and July 23, 2026 editions), which reports live storage for ~166 major reservoirs nationwide. We compare a reservoir's two bulletin readings only with each other — never a bulletin figure against a state-portal figure — because different agencies measure against different storage bases, and the mismatch can masquerade as a huge change. Nagarjuna Sagar is the standing example: it reads in the 30s on Andhra Pradesh's AP-WRIMS portal and 3.2% of live storage in the CWC bulletin, because the two count different volumes. Neither is wrong; they answer different questions, so we never chart them as a single trend. The 149 reservoirs in this analysis are exactly those with a CWC reading in both weeks; reservoirs the bulletin covered only once are excluded. Our sourcing rules are on the methodology page.
The week the refill moved east
Last week's story was the Sahyadris — Pune's dams going from near-empty to full in seven days. This week the monsoon band's heaviest work shifted onto the eastern and central peninsula, and the biggest reservoirs there responded:
These are the reservoirs that actually move the national number: Hirakud alone holds more than 8 km³ at capacity, and a ten-point weekly gain there is worth more stored water than dozens of small Ghats dams filling to the brim. The northern giants — Bhakra and Pong on the Sutlej and Beas — added three points each as Himalayan-fed inflows picked up. The one large exception, Indira Sagar on the Narmada, actually fell 24.7% → 22.3% (−235 million m³): a reservoir releasing water for downstream irrigation and power faster than its catchment is yet replacing it.
The fastest fills: small dams, whole catchments under the rain
The largest percentage swings, as always in the monsoon, belong to small reservoirs whose entire catchment can sit under the rain band at once:
Salanadi in Odisha effectively topped out — from 61% to 99.7% in a single bulletin cycle — and Pench (Totladoh), which straddles the Maharashtra–Madhya Pradesh border, all but filled. The presence of Odisha, Chhattisgarh and Madhya Pradesh names on this list — rather than the Maharashtra sweep of a week ago — is the clearest sign of where the rain fell this week.
State by state: a monsoon map in numbers
Weighted fill across each state's CWC-tracked reservoirs, week over week:
| State |
Reservoirs |
Jul 16 |
Jul 23 |
Change |
| Maharashtra |
32 |
42.0% |
50.4% |
+8.4 |
| Chhattisgarh |
6 |
43.8% |
51.7% |
+7.9 |
| Odisha |
11 |
20.0% |
27.8% |
+7.8 |
| Karnataka |
16 |
40.2% |
46.9% |
+6.7 |
| Uttarakhand |
3 |
21.4% |
26.2% |
+4.8 |
| Jharkhand |
7 |
13.1% |
16.2% |
+3.1 |
| Gujarat |
17 |
27.2% |
29.0% |
+1.7 |
| Uttar Pradesh |
6 |
12.1% |
13.3% |
+1.2 |
| Madhya Pradesh |
12 |
34.5% |
35.1% |
+0.6 |
| Rajasthan |
8 |
31.8% |
31.7% |
−0.1 |
| Telangana |
5 |
10.4% |
10.3% |
−0.1 |
| Tamil Nadu |
7 |
33.7% |
32.3% |
−1.3 |
| Andhra Pradesh |
4 |
33.5% |
31.4% |
−2.1 |
Read top to bottom, this is a weather map. The monsoon band sat over the western coast, the central tribal belt and Odisha this week — Maharashtra, Chhattisgarh, Odisha, Karnataka all added six to eight points — while the far south stayed dry. Andhra Pradesh and Telangana, which share the near-empty Krishna-basin giants, are the only large states still losing storage. Their dams are not waiting on a late monsoon so much as on upstream inflows that will not arrive until the rain reaches the Western Ghats headwaters of the Krishna and Tungabhadra — a catchment the band has yet to cover this season.
Where the water is still going down
Thirty-one reservoirs fell this week, and the list separates two very different stories. In the south, Somasila (35.3% → 33.0%), Kandaleru (38.1% → 35.7%) and Pulichintala (45.2% → 43.0%) are draining because the rain simply hasn't come — storage spent on irrigation with nothing yet replacing it. Elsewhere the drawdowns are operational: Donkarayi in Odisha dropped 94% → 78% even as the state around it filled, a hydropower reservoir passing water downstream, and Vani Vilas Sagar in Karnataka slipped eight points from a high base. A mid-monsoon fall is not automatically a drought signal — releases are decisions as much as weather outcomes — but in the Krishna basin the two coincide, which is why the southern peninsula remains the country's tightest water story going into August.