First, what Puerto Rico does not publish
Every other country on this site reports how much water is sitting behind its dams. Puerto Rico does not. The USGS parameter for reservoir storage returns no data at all for the territory — not in real time, and not in the historical record going back to 1990. No agency publishes the elevation-to-volume curve that would let anyone convert one into the other.
That is why you will not find a "Puerto Rico reservoirs are X% full" figure anywhere, including here. What is published, every 15 minutes and with daily values stretching back decades, is the elevation of the water surface in metres above sea level. So that is what we track, and every number in this article is a level, not a volume.
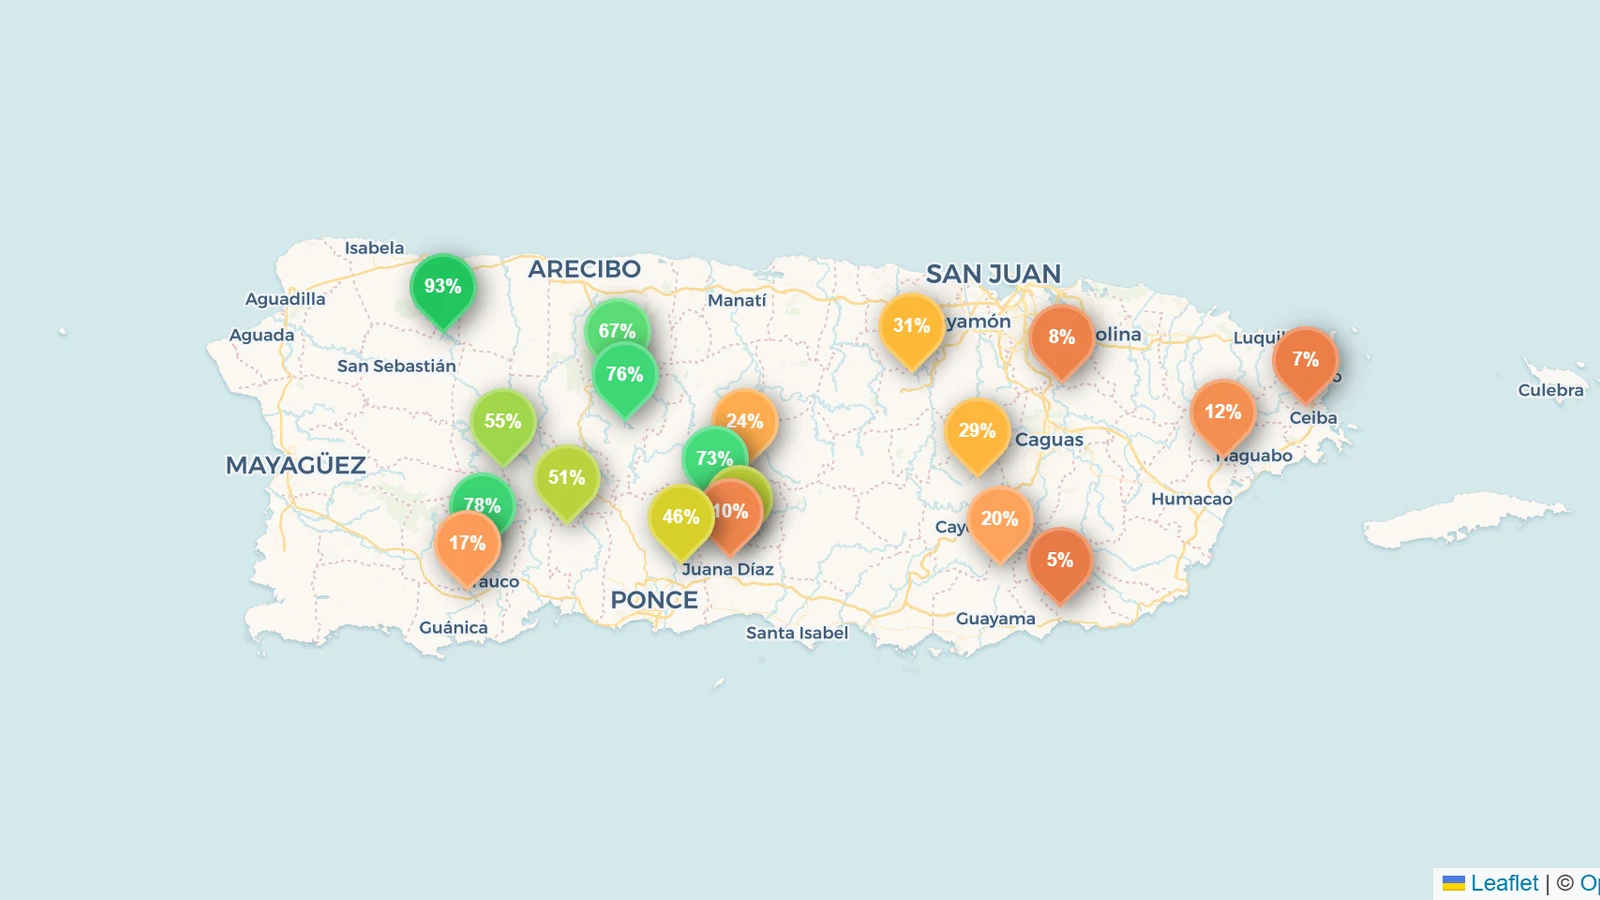
To answer "is this low?" without inventing a capacity, we compare each day's level against every reading for the same calendar month across the whole record. When we say Carraízo is at the 8th percentile, it means only 8% of all August days on record were lower. The full method is on the Puerto Rico page.
The metro supply, in context
The rationing announced this week covers parts of San Juan and surrounding municipalities. Two reservoirs feed that area, and they are telling different stories.
| Reservoir |
9 Aug 2026 |
9 Aug 2020 |
9 Aug 2015 |
Rank for the date |
Seasonal percentile |
| Carraízo (Trujillo Alto) |
37.49 m |
40.86 m |
33.86 m |
4th lowest of 37 |
8% |
| La Plata (Toa Alta) |
46.63 m |
51.00 m |
35.49 m |
13th lowest of 37 |
30.6% |
| Cidra |
400.12 m |
402.78 m |
399.44 m |
10th lowest of 36 |
29.1% |
Source: USGS daily values, parameter 72375, converted from feet to metres. Cross-checked against PREPA's own operational feed, which agrees to the centimetre.
Carraízo is the one under pressure. It has been below its August median all month, and its annual minimum so far — 37.49 m, reached on 9 August — is the tenth-lowest in 37 years. That ranking deserves a caveat in both directions: Carraízo's yearly low usually arrives between mid-July and late September, so the 2026 minimum is probably not in yet, and the ranking can still worsen.
La Plata is the surprise. At the 31st percentile it is unremarkable for the season, and it is more than eleven metres above where it sat during the 2015 rationing. If the metro's water problem were purely a question of how much rain has fallen into its reservoirs, La Plata would not look like this.
Why "higher than 2015" does not mean "better off than 2015"
Here is where a level-only record becomes genuinely misleading if you read it naively, and it is worth spelling out.
A reservoir's elevation tells you where the water surface is. It does not tell you how much water is underneath — and in Puerto Rico, the volume underneath a given elevation has been shrinking for decades. Sediment washed down by hurricanes and tropical storms settles in the reservoir and permanently occupies space that used to hold water. Across the island, capacity losses to sedimentation range from 12% to 81% depending on the reservoir, according to USGS figures cited in a 2023 peer-reviewed survey of Puerto Rico's reservoirs.
Carraízo is one of the badly affected ones. It was dredged in 1997, and in the 25 years that followed it accumulated 4.39 million m³ of new sediment — the basis for the $88.7 million dredging project funded in 2022. The Financial Oversight and Management Board noted in November 2022 that the reservoir, built in 1953, had "not been fully dredged in 25 years" while delivering roughly 90 million gallons a day to the Sergio Cuevas filtration plant in Trujillo Alto.
The consequence for reading this article's own numbers: Carraízo at 37.49 m in 2026 is holding less water than Carraízo at 37.49 m would have held in 2001. A same-elevation comparison across decades systematically flatters the present. So "3.63 m above 2015" is an accurate statement about water level and an optimistic one about water available — and rationing at a higher elevation than 2015 is exactly what a silting reservoir would produce.
We are not able to quantify that gap. Doing so would need the elevation-to-volume curve that Puerto Rico does not publish, and we will not estimate one.
The driest reservoirs are not the ones being rationed
Ranked by how unusual today's level is for the time of year, the metro is not where the record is closest to breaking.
| Reservoir |
Level |
Rank for 9 August |
Seasonal percentile |
| Patillas |
63.74 m |
2nd lowest of 32 |
5.4% |
| Fajardo |
47.42 m |
2nd lowest of 15 |
7% |
| Carraízo |
37.49 m |
4th lowest of 37 |
8% |
| Guayabal |
102.26 m |
5th lowest of 31 |
9.8% |
| Río Blanco |
25.42 m |
3rd lowest of 17 |
12.3% |
Patillas and Guayabal sit on the southern coastal plain; Fajardo and Río Blanco are in the east. None of them supplies the San Juan metropolitan area. Patillas at its second-lowest 9 August in 32 years is the single most extreme reading on the island, and it is carrying PREPA's "Safety" operating status — a reminder that the official bands describe operational headroom above dead storage, not seasonal rarity, and that the two can point in different directions.
At the other end, six reservoirs are above their seasonal norm. Guajataca in the north-west is higher than 93% of its recorded Augusts, and El Guineo in the central mountains is above its overflow threshold. Puerto Rico is 180 km across, and this drought is not evenly distributed across it.
What the reservoirs cannot explain
A reservoir record is a partial account of a water crisis, and in Puerto Rico it is a smaller part than usual.
Reporting by The New York Times on 7 August set out the rest: a major pipeline ruptured in June, cutting service to tens of thousands of customers in the San Juan area, with interruptions persisting after the repair. Félix Aponte Ortiz, a water-management specialist quoted in that account, estimates that up to 60% of the water in the island's system never reaches customers. Residents interviewed described service failing long before the drought — one in Santurce said she had gone 80 consecutive days without running water.
The meteorological signal is real and is measured elsewhere: the US Drought Monitor has more than half the archipelago in moderate-to-extreme drought, and a National Weather Service hydrologist described the San Juan area's driest July in more than a century. That is rainfall, not reservoir level, and the two are not interchangeable — a catchment can record its driest month on the instrument record while the reservoir behind it is drawn down or held up by operating decisions.
Put together: a reservoir steadily losing usable space to sediment, a distribution network losing most of what leaves it, and the driest July in a century. The reservoir levels in this article are one of those three, and on their own they would not have produced rotating shutoffs.
What to watch
Carraízo's annual minimum has not historically arrived until late August or September, so the ranking in this article can still deteriorate. The National Weather Service hydrologist quoted by the Times warned of a possible "five or six months of below-normal precipitation" across the north-eastern Caribbean.
The two levels worth watching are Carraízo's approach to its 2015 low of 33.86 m — still more than three and a half metres below today — and whether Patillas and Fajardo, already at their second-lowest readings for the date, set outright records. All 19 reservoirs update daily on the Puerto Rico page.
Sources and method
Levels are USGS National Water Information System daily values, parameter 72375 (lake or reservoir elevation above local mean sea level), converted from feet to metres, with records beginning in 1990 for the longest series. Every reading is cross-checked against the Puerto Rico Electric Power Authority's operational feed, which publishes the same figures in metres and agrees with USGS to the centimetre. Operating thresholds are PREPA's own published bands.
Sedimentation figures are from Going with the flow: the supply and demand of sediment retention ecosystem services for the reservoirs in Puerto Rico (Frontiers in Environmental Science, 2023), citing USGS 2019 and FEMA 2022, and from the Financial Oversight and Management Board for Puerto Rico. Rationing measures, distribution losses and drought extent are as reported by The New York Times, 7 August 2026, and the US Drought Monitor.
Puerto Rico publishes no reservoir storage volume, so no figure in this article is a percentage of capacity. Where we give a percentile, it is a rank against the same calendar month across the full record. Our full methodology is on the Puerto Rico page.