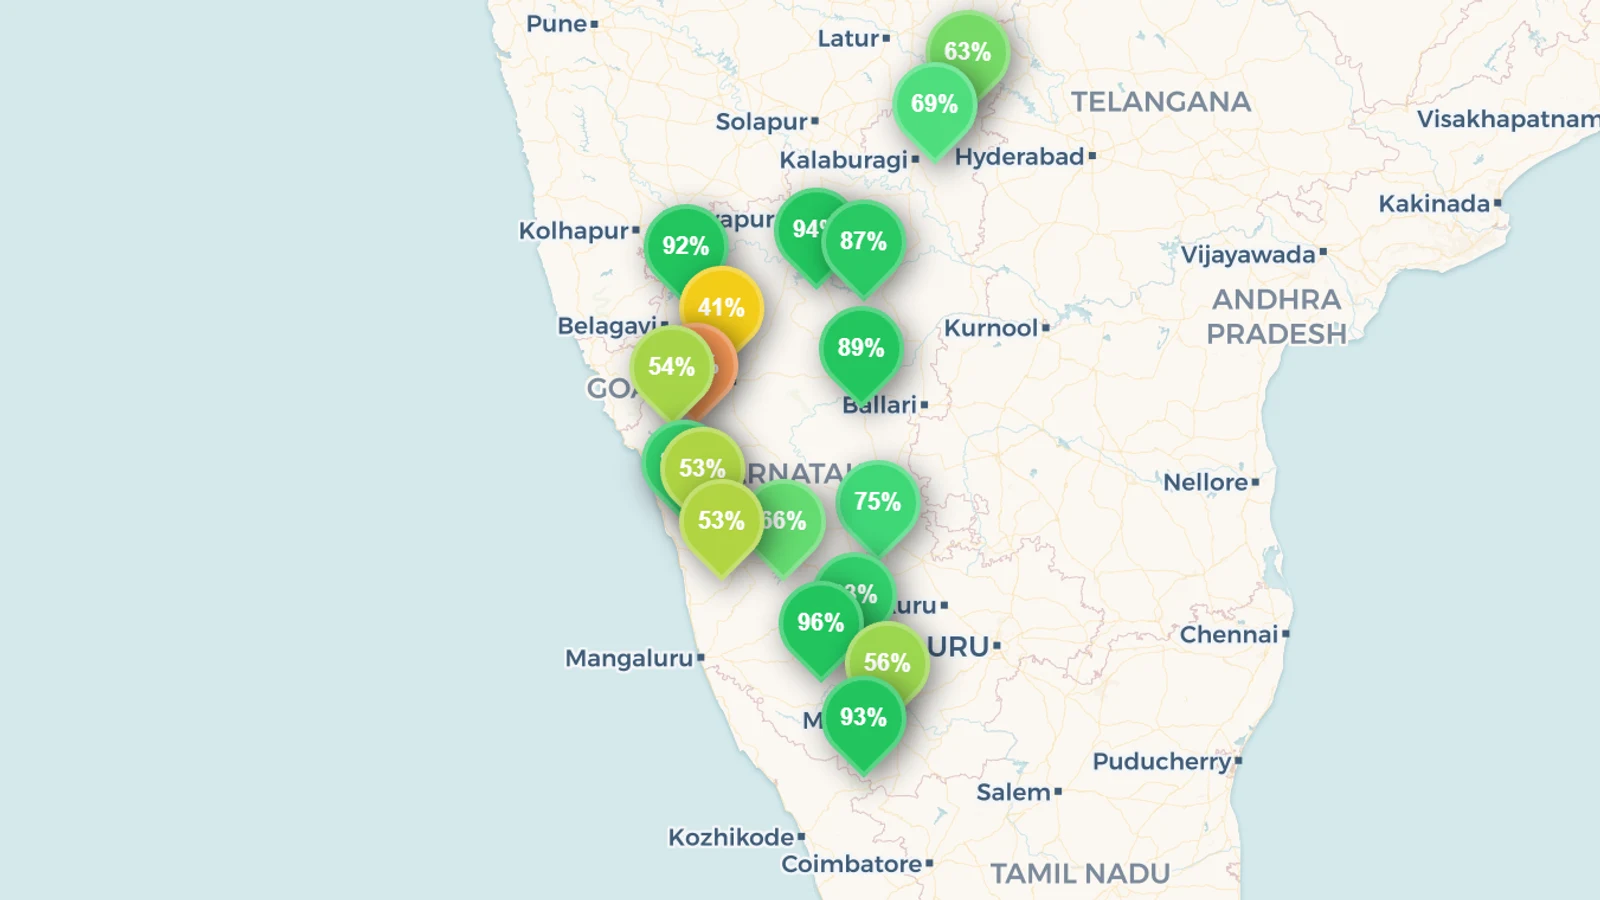
As of the CWC bulletin of 13 August 2026, Karnataka's 18 major reservoirs are 69.3% full on the Commission's own live-storage percentages — a reversal of the state we described six weeks ago. In the July edition the biggest storages were close to empty: Almatti sat at 2.9%, Tungabhadra at 3.3%, and Krishnaraja Sagar — the Cauvery dam that supplies Bengaluru and Mysuru — at 6.7%. They now read 92.4%, 82.7% and 56.2%. The Krishna system has banked its year. The Cauvery has not caught last year's. On the 13 dams that reported in both mid-August 2025 and mid-August 2026, storage is 61.1% against 86.0% a year ago. The live state figure and the dam-by-dam map are on the Karnataka reservoir levels page.
Key takeaways
- Karnataka is 69.3% full (13 August 2026), up from 14.0% on 2 July — a gain of 55.3 points in six weeks, and 11.7 points in the week to 13 August. The live figure is on the Karnataka page.
- The Krishna giants filled. Almatti went from 2.9% to 92.4%, above its 89% August average; Narayanpur from 18.0% to 88.3%; Tungabhadra from 3.3% to 82.7%, of which 31.4 points arrived in a single week.
- Krishnaraja Sagar (KRS) is 56.2% full — up from 6.7% on 2 July, still 21.8 points below its 78% August average and 42.4 points below the 98.6% it held on 14 August 2025.
- Malaprabha is the widest gap among the majors: 41.2% against a 73% August average and 89.3% a year ago.
- The Cauvery as a group is 74.4% full, against 17.8% on 2 July. Kabini (93.2%) and Harangi (95.9%) are at or above last year; KRS and Hemavathy are not.
- The state is still behind 2025. On 13 dams with a reading in both years, mid-August storage is 61.1% now against 86.0% on 14 August 2025. Four dams are ahead of last year; nine are behind.
- Only Tattihalla remains below 20% (16.7%). Four dams are above 90%: Almatti, Hidkal, Kabini and Harangi.
Karnataka reservoir levels, dam by dam (13 August 2026)
Capacity is gross storage capacity, given in TMC (thousand million cubic feet, the unit used in Indian water reporting) and MCM (million cubic metres). "Fill" is the Central Water Commission's live-storage percentage. "Week" is the change in percentage points since the 6 August bulletin; "August average" is the mean August level on each dam's own chart. Two dams joined our series in July 2026 and have no multi-year history yet, so their average reads "—".
| Dam |
Basin |
Capacity (TMC) |
Capacity (MCM) |
Fill, 13 Aug |
Week |
August average |
| Almatti (LBS Sagar) |
Krishna |
129.7 |
3,673 |
92.4% |
+8.8 |
89% |
| Tungabhadra |
Krishna |
105.8 |
2,996 |
82.7% |
+31.4 |
73% |
| Bhadra |
Krishna |
66.5 |
1,882 |
65.5% |
+9.1 |
80% |
| Linganamakki |
West Flowing |
53.4 |
1,512 |
52.9% |
+6.9 |
74% |
| Krishnaraja Sagar (KRS) |
Cauvery |
48.4 |
1,370 |
56.2% |
+9.0 |
78% |
| Supa (Kalinadi) |
West Flowing |
42.7 |
1,208 |
54.3% |
+5.2 |
68% |
| Narayanpur |
Krishna |
37.6 |
1,066 |
88.3% |
+41.3 |
54% |
| Ghataprabha (Hidkal) |
Krishna |
37.5 |
1,062 |
91.8% |
+11.5 |
91% |
| Hemavathy |
Cauvery |
37.0 |
1,049 |
83.1% |
+6.9 |
89% |
| Malaprabha |
Krishna |
36.0 |
1,018 |
41.2% |
+7.0 |
73% |
| Mani |
West Flowing |
31.2 |
884 |
52.5% |
+6.3 |
73% |
| Vani Vilas Sagar |
Vedavati |
28.3 |
802 |
75.4% |
−0.4 |
76% |
| Kabini |
Cauvery |
18.3 |
519 |
93.2% |
+1.6 |
90% |
| Harangi |
Cauvery |
12.1 |
343 |
95.9% |
0.0 |
94% |
| Tattihalla |
West Flowing |
8.8 |
249 |
16.7% |
+3.2 |
49% |
| Karanja |
Godavari |
7.7 |
218 |
62.5% |
+0.9 |
— |
| Bennithora |
Krishna |
5.3 |
150 |
69.3% |
−0.6 |
— |
| Gerusoppa |
West Flowing |
4.6 |
130 |
80.8% |
−0.8 |
71% |
Where Karnataka's reservoir data comes from
The figures here come from the Central Water Commission (CWC), India's national water agency, whose weekly bulletin covers the country's largest reservoirs. reservoirs.earth mirrors that bulletin and keeps each dam's multi-year history; the snapshot in this edition is 13 August 2026, and all 18 of the state's tracked dams reported. Three Krishna-system dams — Almatti, Tungabhadra and Narayanpur — sit in our live feed as a later Andhra Pradesh WRIMS reading (19 August); the weekly series used below is the CWC bulletin through 13 August, so every dam in the table is on the same day. The state percentage is the live-storage-weighted mean of those CWC percentages, so Almatti and Tungabhadra move the headline far more than the Cauvery headwaters dams do. India's national water data is harder to access than most countries we track, which is why India scores low on the Reservoir Transparency Index; the CWC bulletin nonetheless covers Karnataka's major dams.
Six weeks that reversed the year
Read the season bulletin by bulletin. Early July was the floor; the last two weeks did most of the work:
| Bulletin |
25 Jun |
2 Jul |
9 Jul |
16 Jul |
23 Jul |
30 Jul |
6 Aug |
13 Aug |
| Karnataka, % full |
14.0% |
14.0% |
23.6% |
32.7% |
38.0% |
45.3% |
57.6% |
69.3% |
(16 dams reported through 9 July; Karanja and Bennithora entered the series on 16 July, and 18 have reported since.)
The state added nothing between 25 June and 2 July — which is why the July edition described the big dams as waiting on rain — then 9.6 points in the next week, and 11.7 points in the week to 13 August, the strongest bulletin of the season. That matches the national picture in the week of 6 August tracker: the monsoon moved over the southern catchments in earnest.
The comparison that matters is not the floor. On the 13 dams with a mid-August reading in both 2025 and 2026, storage is 61.1% now against 86.0% on 14 August 2025 — 24.9 points behind, with nine of the 13 lower than a year ago. India as a whole was 51.3% full on the same 13 August bulletin. Karnataka is ahead of the country and still short of its own 2025.
The Krishna system: from 5% to 84%
The five Krishna-system dams we treated as a group in July — Almatti, Narayanpur, Tungabhadra, Malaprabha and Ghataprabha, plus Bennithora once it joined — were 5.0% full on 2 July. On 13 August they are 83.9%. That is the refill the July piece said to watch:
- Almatti (92.4%, +8.8) — Karnataka's largest reservoir, 129.7 TMC, was 2.9% full on 2 July against an early-July norm near 70%. It is now a few points above its 89% August average. A later WRIMS reading on 19 August put it at 94.3%. The dam that set the July headline has done the thing a monsoon dam is built to do.
- Tungabhadra (82.7%, +31.4) — the cleanest large weekly jump in the state. It climbed 3.3% → 11.8% → 17.6% → 19.5% → 26.4% → 51.3% → 82.7% across the seven bulletins from 2 July, and it now sits above its 73% August average. Downstream Andhra Pradesh and Telangana take this water.
- Narayanpur (88.3%) — 18.0% on 2 July, now well above a 54% August average. Its week-to-week series is jumpy, so the number to trust is the six-week move, not any single bulletin.
- Ghataprabha (Hidkal) (91.8%, +11.5) — from 6.1% on 2 July to its own 91% August average. The recovery is complete.
- Malaprabha (41.2%, +7.0) — the exception in the Krishna system. It has gained 36.7 points since 2 July and is still 31.8 points under its August average and 48.1 points under last year. A 41% reading in mid-August is not empty. It is the one major Krishna dam that has not banked a normal year.
Bhadra, on the Tungabhadra's headwaters, is 65.5% against an 80% August average and 97.0% a year ago — the same pattern as Malaprabha, one basin over.
The Cauvery: filled in the Ghats, not at KRS
Karnataka's four Cauvery dams were 17.8% full on 2 July and are 74.4% on 13 August. The aggregate hides the dam that people search for.
- Krishnaraja Sagar (KRS) (56.2%, +9.0) — 48.4 TMC gross, 6.7% on 2 July, 56.2% now. Last 14 August it was 98.6%. The year before that, 94%. Its August average is 78%. The monsoon has arrived in the Cauvery; it has not rebuilt last year's surplus at the dam that feeds Bengaluru and Mysuru and whose releases to Tamil Nadu are the politically watched number.
- Kabini (93.2%) and Harangi (95.9%) — the two Cauvery dams that are ahead of last year (Kabini 90.8% on 14 August 2025; Harangi 90.4%). Kabini was 9.3% on 2 July. That is a Western Ghats catchment doing what the July piece said it would do once the rain landed.
- Hemavathy (83.1%) — 32.4% on 2 July, still 5.9 points under its 89% August average and 16 points under last year. The earliest July uptick we flagged has continued; it has not closed the gap.
What "% full" means on this chart
Three readings in this edition are easy to misread, and the history is what separates them.
A percentage is always against that dam's own live capacity, on that day. Almatti at 92% and KRS at 56% were both near empty on 2 July. One is now above its August normal; the other is 22 points below it. Same monsoon, two catchments, two answers.
The right comparison is the same week in earlier years, not the full mark. Karnataka is supposed to be low in early July and high in August. 14% on 2 July was the seasonal floor — and, as the July edition said, it was low for July. 69% on 13 August is a filled monsoon — and, against 2025, it is still a short year. Malaprabha at 41% is the clearest case: well above dead storage, far below its own August chart.
Some dams are operated, not just filled. Linganamakki (52.9% against a 74% August average and 94.9% last year) and Supa (54.3% against 68%) are west-flowing hydro storages; their level is power operations plus rainfall. Gerusoppa at 80.8% is a small downstream balancing pond on the Sharavathi, kept near full for the hydro scheme — plumbing, not basin supply. Vani Vilas Sagar at 75.4% has barely moved all season, which is how a small Vedavati reservoir behaves.
Capacity in TMC
Indian water reporting measures storage in TMC — one thousand million cubic feet, equal to 28.3168 million cubic metres (MCM). The table above gives both:
Gross capacity is not usable water: every dam holds dead storage below its intakes, and CWC reports live storage against its own live-capacity figure, so a percentage and a volume taken from different sources will not always reconcile. These are the levels in the 13 August 2026 bulletin; Tungabhadra moved 31 points in a week, so compare each dam to the same week in earlier years on its own chart rather than to its annual average.
What to watch in September
The southwest monsoon typically withdraws from interior Karnataka in late September, so there are perhaps five or six bulletins of filling weather left. The Krishna question has flipped from will it fill to how it is released. The Cauvery question has not.
Does KRS close any of the 22-point gap to its August normal before the Cauvery catchment dries, or does Bengaluru go into the northeast-monsoon wait already short of 2025? Does Malaprabha keep climbing, or does 41% in mid-August become the year's high? And do Linganamakki and Supa recover any of the 20–40 points they sit below last August, or is the west-flowing hydro system going into the dry season thin? The honest summary: Karnataka has had the monsoon the July edition was waiting for, has filled the Krishna, and has not replaced last year's Cauvery surplus.
This is the August 2026 edition, following India Reservoir Levels, August 2026 for the national picture and the week of 6 August monsoon tracker. It updates the July 2026 edition, whose wait for rain this bulletin answers. We track the major Indian water economies month by month — see the Maharashtra and Madhya Pradesh August editions — and you can follow Karnataka between bulletins on the Karnataka reservoir levels page.