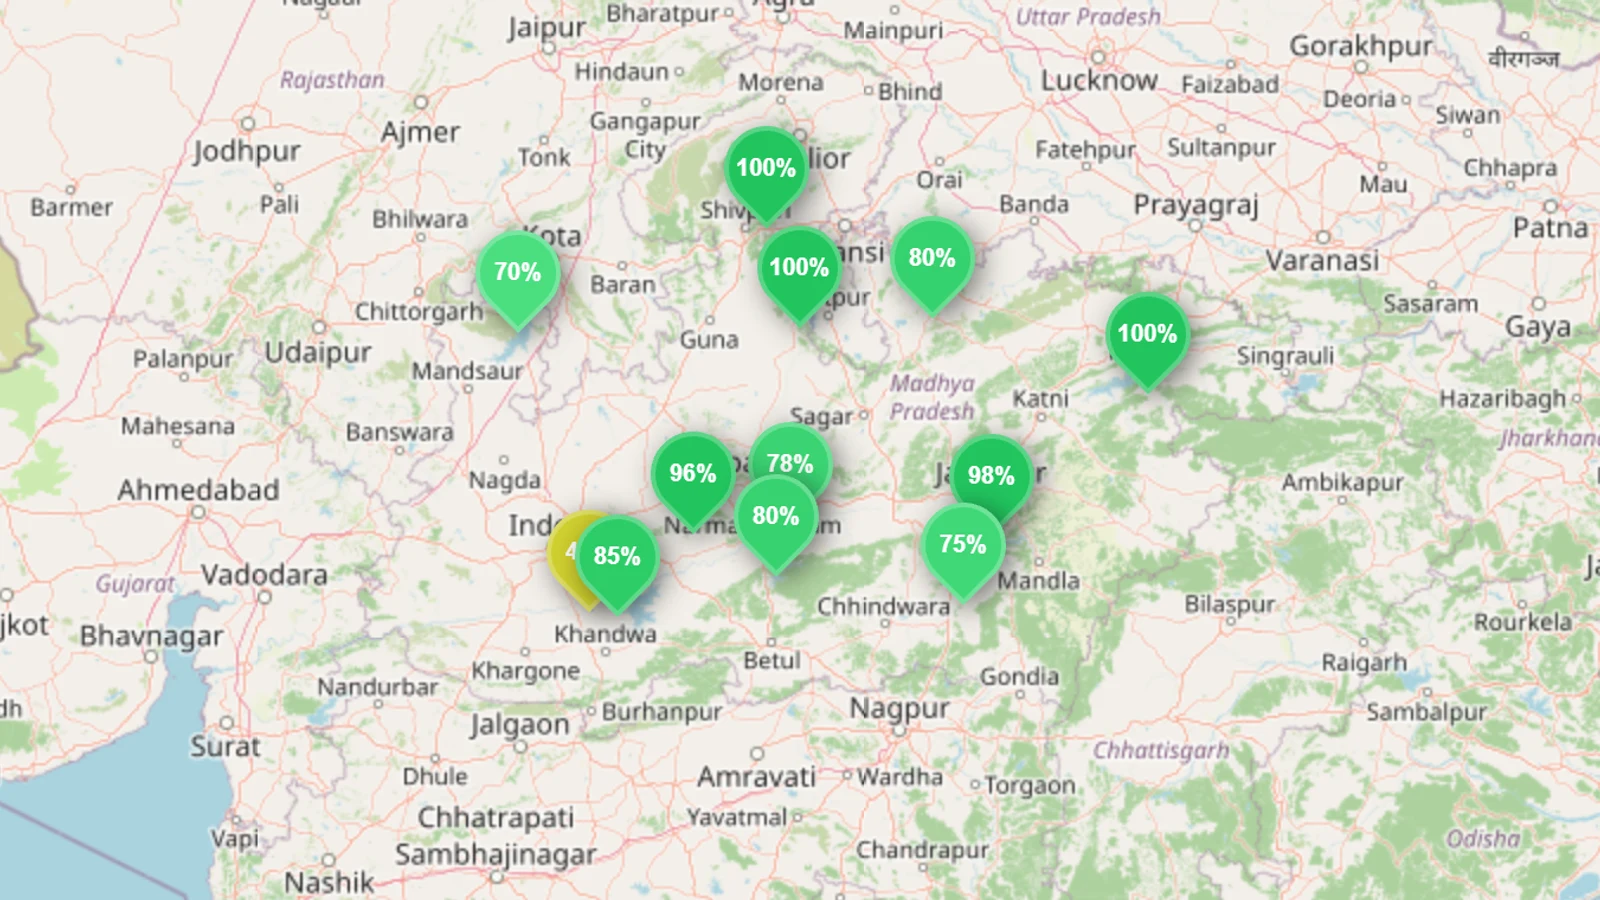
As of the CWC bulletin of 17 September 2026, Madhya Pradesh's 12 major reservoirs are holding 76.3% of their combined capacity — up 35.4 points from the 40.9% we reported in the August edition. Indira Sagar, India's largest reservoir by capacity, has gone from 31.5% to 84.6%. The monsoon catch-up that August only promised has arrived. The state is still 7.5 points behind the same week in 2025 (83.8%), but the hole is no longer the Narmada valley in free fall — it is a thinner cushion on a few dams, led by Gandhi Sagar and Tawa. The live state figure and the dam-by-dam map are on the Madhya Pradesh reservoir levels page. This is the September edition of a monthly check-in: the season that started empty has closed near full.
Key takeaways
- Madhya Pradesh is 76.3% full (17 September 2026), up from 40.9% on 6 August — a gain of 35.4 points in six weeks. The live figure is on the Madhya Pradesh page.
- It is 7.5 points behind last year. On 17 September 2025 the same 12 dams were 83.8% full. The August gap was 26.5 points; most of that has closed.
- Indira Sagar did the heavy lifting. India's largest reservoir (431.6 TMC) climbed from 31.5% to 84.6% — still 5.4 points under its September average (90%) and 6.8 under last year, but no longer the state's open wound.
- The five Narmada-basin dams are 68.2% full, against 26.9% on 6 August and 73.9% a year ago. The valley filled; it did not quite match 2025.
- Gandhi Sagar is no longer the cushion. The Chambal dam that sat at its August normal (62.3%) is now 70.1% — 11.9 points under its September average and 20.8 behind last year. It has flipped from bright spot to the largest YoY gap among the majors.
- Three dams are full or effectively full: Bansagar, Rajghat and Atal Sagar. None of the 12 is below 20% — Rangawan was 15.8% in early August and is now 80.3%.
Madhya Pradesh reservoir levels, dam by dam (17 September 2026)
Capacity is gross storage capacity, given in TMC (thousand million cubic feet, the unit used in Indian water reporting) and MCM (million cubic metres). "Week" is the change in percentage points since the 10 September bulletin; "September average" is the mean September level on each dam's own chart.
| Dam |
River |
Capacity (TMC) |
Capacity (MCM) |
Fill, 17 Sep |
Week |
September average |
| Indira Sagar |
Narmada |
431.6 |
12,221 |
84.6% |
−0.6 |
90% |
| Gandhi Sagar |
Chambal |
258.6 |
7,322 |
70.1% |
+2.1 |
82% |
| Bansagar |
Son |
191.1 |
5,410 |
100% |
0.0 |
98% |
| Bargi (Rani Avantibai Sagar) |
Narmada |
138.5 |
3,921 |
98.3% |
+5.8 |
98% |
| Tawa |
Tawa |
71.1 |
2,014 |
79.5% |
+3.7 |
95% |
| Omkareshwar |
Narmada |
41.3 |
1,170 |
47.2% |
+24.5 |
47% |
| Rajghat |
Betwa |
36.8 |
1,043 |
100% |
+3.6 |
97% |
| Atal Sagar |
— |
29.5 |
835 |
99.6% |
−0.4 |
88% |
| Sanjay Sarovar |
— |
17.9 |
508 |
74.8% |
+5.5 |
75% |
| Barna |
— |
16.1 |
456 |
77.7% |
−1.3 |
91% |
| Kolar |
Kolar |
6.3 |
179 |
95.7% |
+3.1 |
88% |
| Rangawan |
— |
5.5 |
155 |
80.3% |
+5.8 |
51% |
| State total |
— |
1,244.3 |
35,234 |
76.3% |
+1.4 |
~87% |
Where Madhya Pradesh's reservoir data comes from
The figures here come from the Central Water Commission (CWC), India's national water agency, whose weekly bulletin covers the country's largest reservoirs. reservoirs.earth mirrors that bulletin and keeps each dam's multi-year history; the most recent reading in this snapshot is 17 September 2026, and all 12 of the state's tracked dams reported. The state percentage is capacity-weighted — total water stored divided by total capacity — so the Narmada giants move it far more than the small dams do. India's national water data is harder to access than most countries we track, which is why India scores low on the Reservoir Transparency Index; the CWC bulletin nonetheless covers Madhya Pradesh well, because several of India's biggest dams sit here.
From 41% to 76% in six weeks
The August edition caught the turn. September catches the close. On the same 12 dams:
| Bulletin |
2 Jul |
6 Aug |
27 Aug |
3 Sep |
10 Sep |
17 Sep |
| Madhya Pradesh, % full |
29.7% |
40.9% |
67.7% |
71.2% |
74.9% |
76.3% |
Two things stand out. First, the fastest stretch was mid-to-late August — the state added nearly 27 points between 6 and 27 August — while early September slowed to 1–4 points a week as several dams approached full. Second, the year-on-year gap shrank from 26.5 points on 6 August to 7.5 points now. The national India Reservoir Levels, September 2026 piece already flagged Madhya Pradesh's recovery at the 3 September reading (71%); the two bulletins since have added another five points and confirmed that Indira Sagar, not the Chambal, carried the finish.
The monsoon typically withdraws from the state in late September. At 76.3%, Madhya Pradesh is banking a workable rabi cushion — thinner than 2025, far healthier than the July floor of 29.7%.
Indira Sagar closed the hole
More than a third of Madhya Pradesh's tracked storage sits in Indira Sagar alone (431.6 TMC / 12,221 MCM). In August it was 31.5% full and 52.7 points behind the same week in 2025. On 17 September it is 84.6% — a gain of 53 points in six weeks — against a September average of 90% and 91.4% a year ago. The remaining gap is single digits. That single dam is why the state figure moved from the low 40s to the mid-70s.
Around it, the Narmada group tells a similar story with one lagging edge:
- Bargi (98.3%, +5.8 this week) — at its September average and essentially level with last year. The healthiest of the Narmada storages.
- Tawa (79.5%, +3.7) — up from 23.5% in early August, still 15.5 points under its September average (95%) and 20.5 behind last year's full mark. Tawa irrigates a large command area; absolute recovery is real, the YoY shortfall is not gone.
- Omkareshwar (47.2%, +24.5) — the week's biggest mover after sitting flat for much of the season. At its own September average of 47%, but 26.7 points behind last year (73.9%). As a run-of-river dam it banks less than Indira Sagar; read it against its own chart.
- Kolar (95.7%) — ahead of last year and above its September average.
Together the five Narmada-basin dams hold 19,505 MCM — 55% of the state's tracked capacity — and are 68.2% full, against 26.9% on 6 August and 73.9% on the same week in 2025.
The Chambal flipped; the Son and Betwa are full
Outside the Narmada the cast has changed since August:
- Gandhi Sagar (70.1%) on the Chambal was the only major dam at normal in August and the only one ahead of 2025. It is now the soft spot among the giants: 11.9 points under its September average and 20.8 behind last year. The state figure is higher despite Gandhi Sagar, not because of it.
- Bansagar (100%) on the Son and Rajghat (100%) on the Betwa are full — matching last year and sitting at or above their September averages.
- Atal Sagar (99.6%) is effectively full and ahead of 2025. Barna (77.7%) and Sanjay Sarovar (74.8%) are comfortable in absolute terms but still short of last September.
- Rangawan (80.3%) was the emptiest dam in the state in August at 15.8%; it is now well above its own September average of 51%.
Capacity in TMC: how to read these numbers
Indian water reporting measures storage in TMC — one thousand million cubic feet, equal to 28.3168 million cubic metres (MCM). International sources, including most of reservoirs.earth, publish MCM or km³. The table above gives both:
- Indira Sagar: 431.6 TMC gross capacity (12,221 MCM) — the largest in India.
- Gandhi Sagar: 258.6 TMC (7,322 MCM).
- Tawa: 71.1 TMC (2,014 MCM).
- Madhya Pradesh, all 12 tracked dams: 1,244.3 TMC (35,234 MCM).
Two cautions. Gross capacity is not usable water: every dam holds a dead-storage volume below its intakes, and CWC reports live storage against its own live-capacity figure, so a percentage and a volume from different sources will not always reconcile. And a percentage is always a snapshot: these are the levels in the 17 September 2026 bulletin — compare each dam to the same week in earlier years on its own chart rather than to its annual average.
What to watch into the dry season
The monsoon withdrawal from Madhya Pradesh is under way. The next story is drawdown, not refill.
Does Indira Sagar hold the mid-80s into October, or does late-season release for power and downstream demand open a fresh gap with 2025? Does Gandhi Sagar keep climbing toward its September normal, or does the Chambal stay the state's soft major? And does Tawa close any of the 20-point YoY gap before rabi demand bites? The honest summary: Madhya Pradesh finished the monsoon near three-quarters full, Indira Sagar recovered, and the state is still a little thinner than last September — with the shortfall now on the Chambal and Tawa, not on an empty Narmada Sagar.
This is the September 2026 edition, following India Reservoir Levels, September 2026 for the national picture. It updates the August 2026 edition and the July 2026 edition. We track the major Indian water economies month by month — see the Karnataka and Maharashtra editions — and you can follow Madhya Pradesh between bulletins on the Madhya Pradesh reservoir levels page.