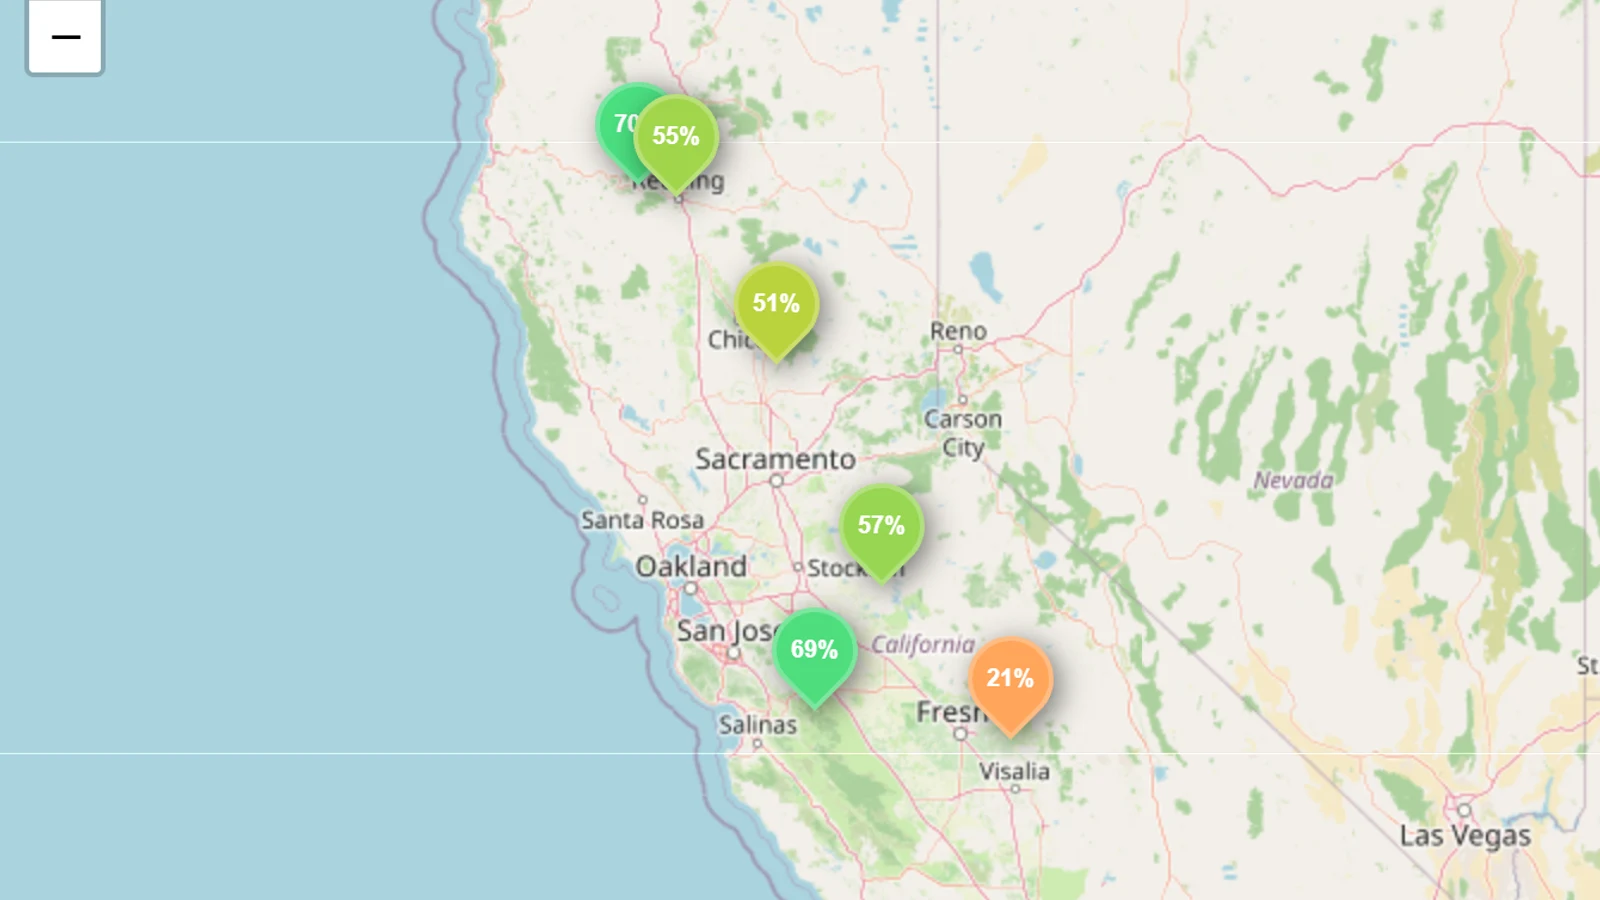
California's 33 monitored reservoirs held 61.4% of capacity in mid-September 2026 — approximately 20.8 km³ of water. Is that normal for this time of year? It depends on the comparison. Storage is well above the drought years of 2021 and 2022, but it is also the lowest September level since the state's reservoirs recovered in 2023.
On a fixed basket of 31 reservoirs, California is at 61.3%, compared with 31.8% in September 2021 and 35.8% in 2022. But the same reservoirs held 73.8% in 2023, 64.6% in 2024 and 62.9% in 2025.
Key takeaways
- California's monitored reservoirs are 61.4% full.
- The comparable basket is 7.5 points above its 2021–2025 average of 53.8%.
- But it is 5.8 points below the post-drought average for 2023–2025.
- Storage is almost double September 2021, but it has now fallen for three consecutive Septembers.
- The summer drawdown was not exceptional. California started summer 2026 with less stored water than in the previous three years.
- Oroville, Shasta, Pine Flat and New Melones explain much of the deficit; San Luis and Trinity remain above their recent September averages.
California's reservoirs at the same point each year
The comparison uses the same 31 reservoirs, measured around 21 September in every year.
| September |
Fill |
Stored water |
| 2021 |
31.8% |
10.7 km³ |
| 2022 |
35.8% |
12.0 km³ |
| 2023 |
73.8% |
24.7 km³ |
| 2024 |
64.6% |
21.7 km³ |
| 2025 |
62.9% |
21.1 km³ |
| 2026 |
61.3% |
20.5 km³ |
This is why "above average" needs context. The 2021–2025 average is pulled down by two severe drought years. Against that baseline, 2026 looks healthy. Against the three years since the 2023 refill, it looks weaker.
The fairest description is that California still has a substantial water reserve, but the cushion created by the wet winter of 2023 is gradually shrinking.
Was this summer's drawdown unusual?
No. On a separate fixed basket of 32 reservoirs with comparable June and September readings, storage fell from 83.0% in June to 61.4% in September — a loss of 21.6 percentage points, or approximately 7.3 km³.
That is close to the drawdown recorded in the previous two summers:
| Year |
June |
September |
Summer change |
| 2023 |
88.2% |
73.8% |
−14.3 points |
| 2024 |
88.6% |
64.7% |
−23.9 points |
| 2025 |
85.4% |
62.9% |
−22.5 points |
| 2026 |
83.0% |
61.4% |
−21.6 points |
California did not experience an exceptional statewide emptying this summer. The 2026 drawdown was slightly smaller than in 2024 and 2025.
The difference is the starting point. Reservoirs entered summer at 83.0%, compared with more than 85% in each of the previous three years. A fairly ordinary summer drawdown therefore produced the lowest September level since 2022.
The reservoirs pulling the average down
Lake Oroville was 50.8% full, compared with a late-September average of 64.7% across 2023–2025.
Shasta Lake stood at 55.2%, around ten points below its recent September average. New Melones was 56.8%, against 65.6%.
The largest percentage gap was at Pine Flat Lake: 20.7% full, compared with a recent September average of 57.5%. Pine Flat entered summer above capacity before irrigation releases reduced it sharply.
Not every major reservoir is below normal. San Luis Reservoir was 69.1% full, more than eight points above its recent September average. Trinity Lake was at 70.1%, slightly above normal.
The statewide percentage therefore hides different conditions across individual watersheds and operating systems.
How does this compare with the wildfire years?
September 2021, a year marked by the Dixie and Caldor fires, had just 31.8% stored in the same reservoir basket. September 2022 stood at 35.8%. California's reservoirs now hold almost twice the percentage recorded in 2021.
That is important for water supply, but it is not a wildfire forecast. Reservoir storage measures water available for cities, farms and hydropower. Wildfire risk depends primarily on vegetation, heat, humidity and wind. California can have comparatively healthy reservoirs and severe fires at the same time.
Our current US dataset does not extend back to September 2020, the state's largest fire season by area burned, so this comparison begins in 2021.
The answer: healthy, but trending down
California is not close to the reservoir conditions of 2021 or 2022. At 61%, the state still holds a substantial carryover into the next water year.
But 61% is not an unequivocally strong number either. Storage has declined from 73.8% in September 2023 to 64.6% in 2024, 62.9% in 2025 and 61.3% now. Another dry winter would begin with a smaller buffer than California had a year ago.
The June edition showed the water California had banked before summer. This September snapshot shows what remains. The US September state comparison places California against the rest of the country. Live levels are available on the California reservoir page, and our source methodology is documented in How we get our data: United States.