Reservoir · California · United States · CDEC
SHASTA DAM
49.8% full
Capacity
5,614.92 hm³
Volume stored
2797 hm³
Vs month average
104% of normal
Coordinates
40.718°N, 122.420°W
Last updated
2026-11-01
Current fill
49.8%vs 7 days ago
-0.8 pplosing
vs 1 year ago
-6.1 ppyear-over-year
7-day trend
→stable
Drought context
Storage vs November average
104%of normal
49.8% full on 2026-11-01, against an average of 47.8% for November across 6 years of readings (+2.0 points).
Drought Monitor at this site · 27 October 2026
D0abnormally dry
The ground at SHASTA DAM's coordinates falls inside the D0 area of the weekly U.S. Drought Monitor map. That describes local conditions — rainfall, soil moisture, streamflow — not the reservoir's storage. California drought figures →
Data source: CDEC — California Dept of Water Resources — daily reservoir storage volume. Capacity is the design (normal full-pool) capacity from the US National Inventory of Dams (NID); fill % = current volume ÷ design capacity. Last reading: 2026-11-01.
Catchment Weather
Past 30 days + 14-day forecast · Open-Meteo
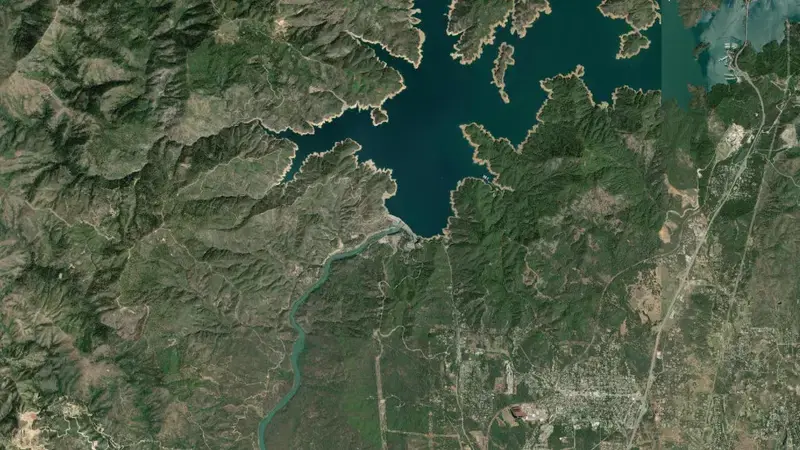
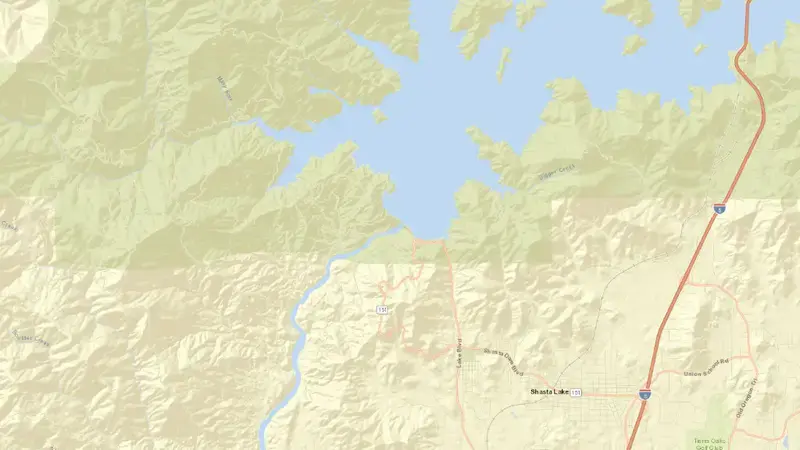
Satellite imagery: Esri, Maxar, Earthstar Geographics. Map: Esri, HERE, Garmin, © OpenStreetMap contributors. 40.718°N, 122.420°W · Open in Google Maps
About SHASTA DAM
As of November 1, 2026, SHASTA DAM is filled to 49.8% of its total capacity, holding 2,797 hm³ of water out of a maximum 5,615 hm³. At this level the reservoir is within its normal operating range.
Over the most recent week on record the fill level has held broadly steady (-0.8 pp), and it is 6.1 points below its level on the same date a year earlier.
Across the readings we hold for SHASTA DAM — 1825 data points between November 3, 2021 and November 1, 2026 — the level has ranged from a low of 22.2% (November 3, 2021) to a high of 98.1% (May 24, 2023). On average the reservoir is fullest around May and at its lowest around November.
It is operated by CDEC primarily for multiple purposes. It is at 40.718°N, 122.420°W.
Key facts
- Current fill level
- 49.8% of total capacity
- Water stored
- 2,797 hm³
- Total capacity
- 5,615 hm³
- 7-day change
- ▼ 0.8 pp
- Year-on-year
- ▼ 6.1 pp
- Primary use
- Multipurpose
- Operator
- CDEC
- Coordinates
- 40.718°N, 122.420°W
- Last updated
- November 1, 2026
Recent readings
| Date | Fill level | Volume (hm³) |
|---|---|---|
| 1 Nov 2026 | 49.8% | 2,797 |
| 31 Oct 2026 | 49.9% | 2,804 |
| 30 Oct 2026 | 50.0% | 2,807 |
| 29 Oct 2026 | 50.1% | 2,812 |
| 28 Oct 2026 | 50.2% | 2,821 |
| 27 Oct 2026 | 50.4% | 2,830 |
| 26 Oct 2026 | 50.5% | 2,838 |
| 25 Oct 2026 | 50.6% | 2,844 |
| 24 Oct 2026 | 50.8% | 2,852 |
| 23 Oct 2026 | 50.9% | 2,861 |
| 22 Oct 2026 | 51.1% | 2,869 |
| 21 Oct 2026 | 51.2% | 2,875 |