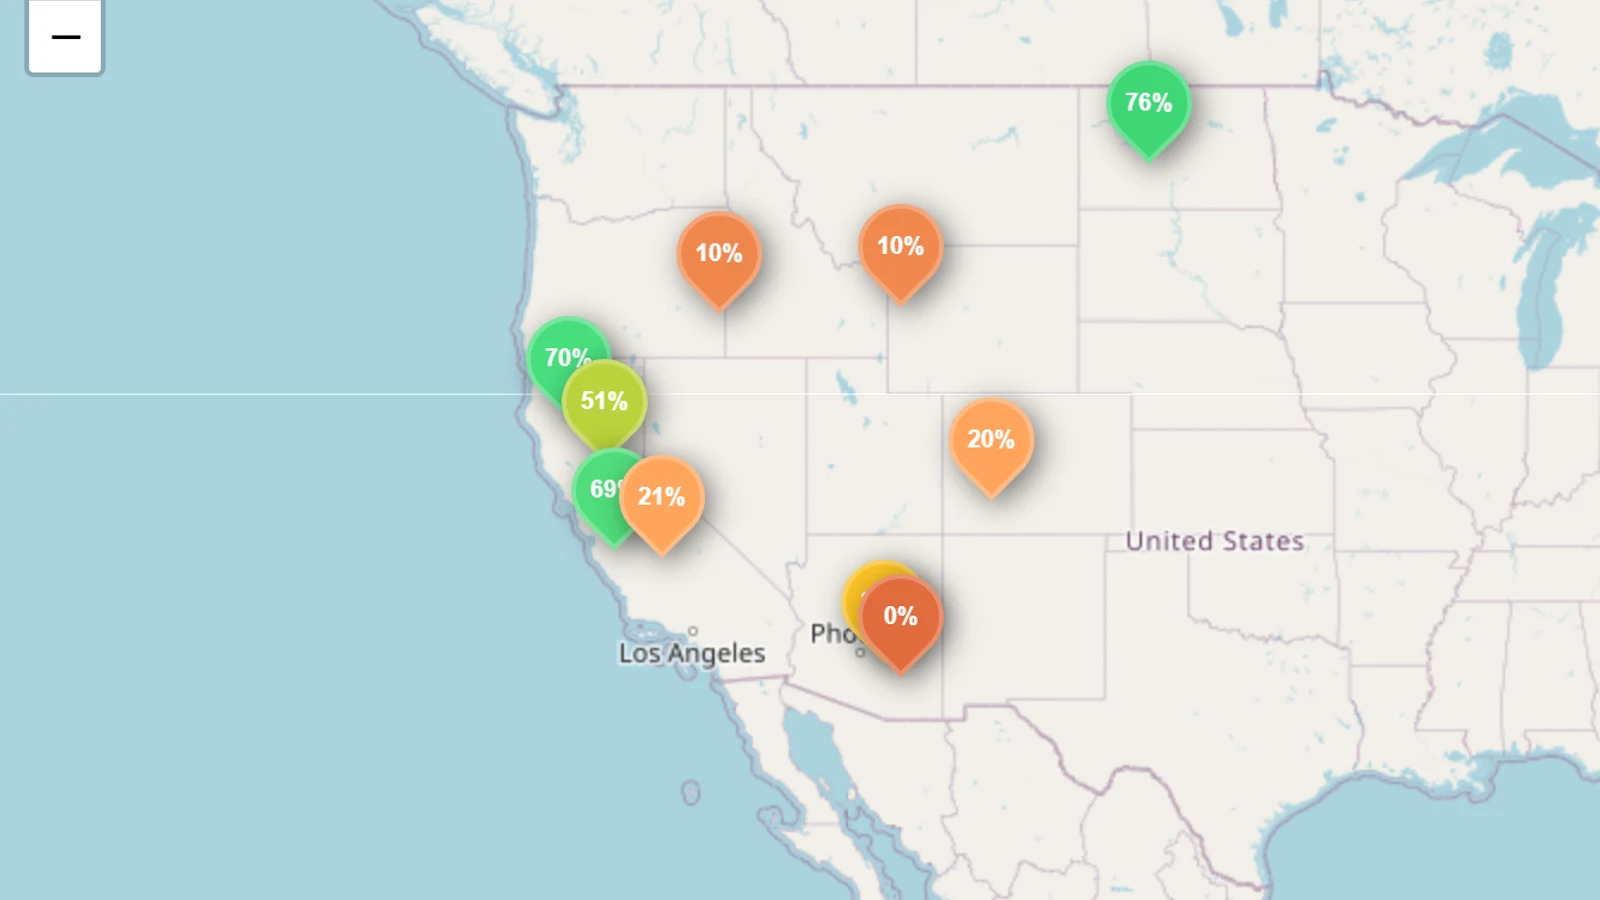
Across a comparable basket of 332 reservoirs, the United States held 54.3% of capacity in September 2026, against a recent September norm of 61.6%. Sixteen of the 19 states with enough history were below their own 2022–2025 baseline. Colorado had the largest gap at 25.9 points below normal; California, Kansas and Louisiana were the only states above it.
The wider live network is larger: 551 reporting reservoirs across 39 states held 56.7% of capacity. The comparison below uses the smaller, like-for-like set for which a September baseline can be calculated.
Key takeaways
- The comparable US basket is 7.3 points below its recent September norm: 54.3% now versus 61.6% across September 2022–2025.
- Colorado is furthest below normal: 45.0% versus 70.9%. Blue Mesa is 19.9%, compared with a 66.4% September baseline.
- Low relative to normal does not always mean low in absolute terms. North Dakota is 75.5% full but 17.9 points below its usual September level.
- The western deficit is broad. Wyoming, Oregon, Arizona, Utah and Idaho are all at least 11 points below their own recent September norms.
- Only three comparable states are above normal. California is 1.4 points above, Kansas 1.2 and Louisiana 1.6 — although Louisiana's comparison rests on one large reservoir.
Reservoir levels by state
Every percentage is capacity-weighted. A large reservoir therefore counts more than a small one, and the current and historical figures use the same set of reservoirs within each state.
The deficit begins upstream
Colorado's state figure is driven by the reservoirs that store Rocky Mountain runoff. Blue Mesa was 46.5 points below its recent September norm. Lake Granby was 52.0% against 89.0%, and Green Mountain 12.5% against 75.0%.
The pattern continues north. In Wyoming, Jackson Lake was 10.3% against a 60.4% baseline. Seminoe and Pathfinder were each about 29 points below normal. Oregon's Lake Owyhee was 10.0%, while Warm Springs was 3.6%.
Arizona is different: 60.3% sounds comfortable, but its comparable reservoirs usually hold 74.9% in September. Roosevelt Lake was 35.3% against a 70.8% baseline, and San Carlos was 0.3%.
Why absolute fill and the anomaly tell different stories
North Dakota is the clearest example. Its reservoirs were 75.5% full — higher than 14 states in the table — yet the state was 17.9 points below normal because Garrison typically sits near 95% in September and was at 76.0%.
The reverse appears in Washington. Its comparable reservoirs were only 22.1% full, but that was almost exactly normal for September. A low seasonal operating level is not automatically an unusual shortage.
California was slightly above normal overall, but not uniformly wet. San Luis and Trinity were well above their baselines, while Oroville and Pine Flat were below. A state average describes the combined storage, not every watershed.
How we calculated the comparison
For each reservoir, we took its latest reading from 1–17 September 2026 and compared it with its average September level in 2022–2025. A reservoir needed observations in at least three of those four previous Septembers. We averaged each year first so that a year with more daily readings did not receive extra weight, then aggregated reservoirs by capacity.
That leaves 332 reservoirs in 19 states. States outside the table either lack sufficient September history in our repository or are not covered by the federal and state feeds we ingest. This is a recent four-year baseline, not a 30-year climatology and not a survey of all US dams.
Sources are USGS NWIS, the Bureau of Reclamation, USACE CWMS, California's CDEC, SRP and the other official feeds listed in How we get our data: United States. Live figures are on the United States reservoir map, and US data openness is assessed in the Reservoir Transparency Index.