The weekly bulletin
The Commission publishes a reservoir storage bulletin every Thursday. The page for it is cwc.gov.in/reservoir-level-storage-bulletin. The 1 October and 15 October figures below are taken from news reports of those bulletins. This page did not transcribe a bulletin PDF.
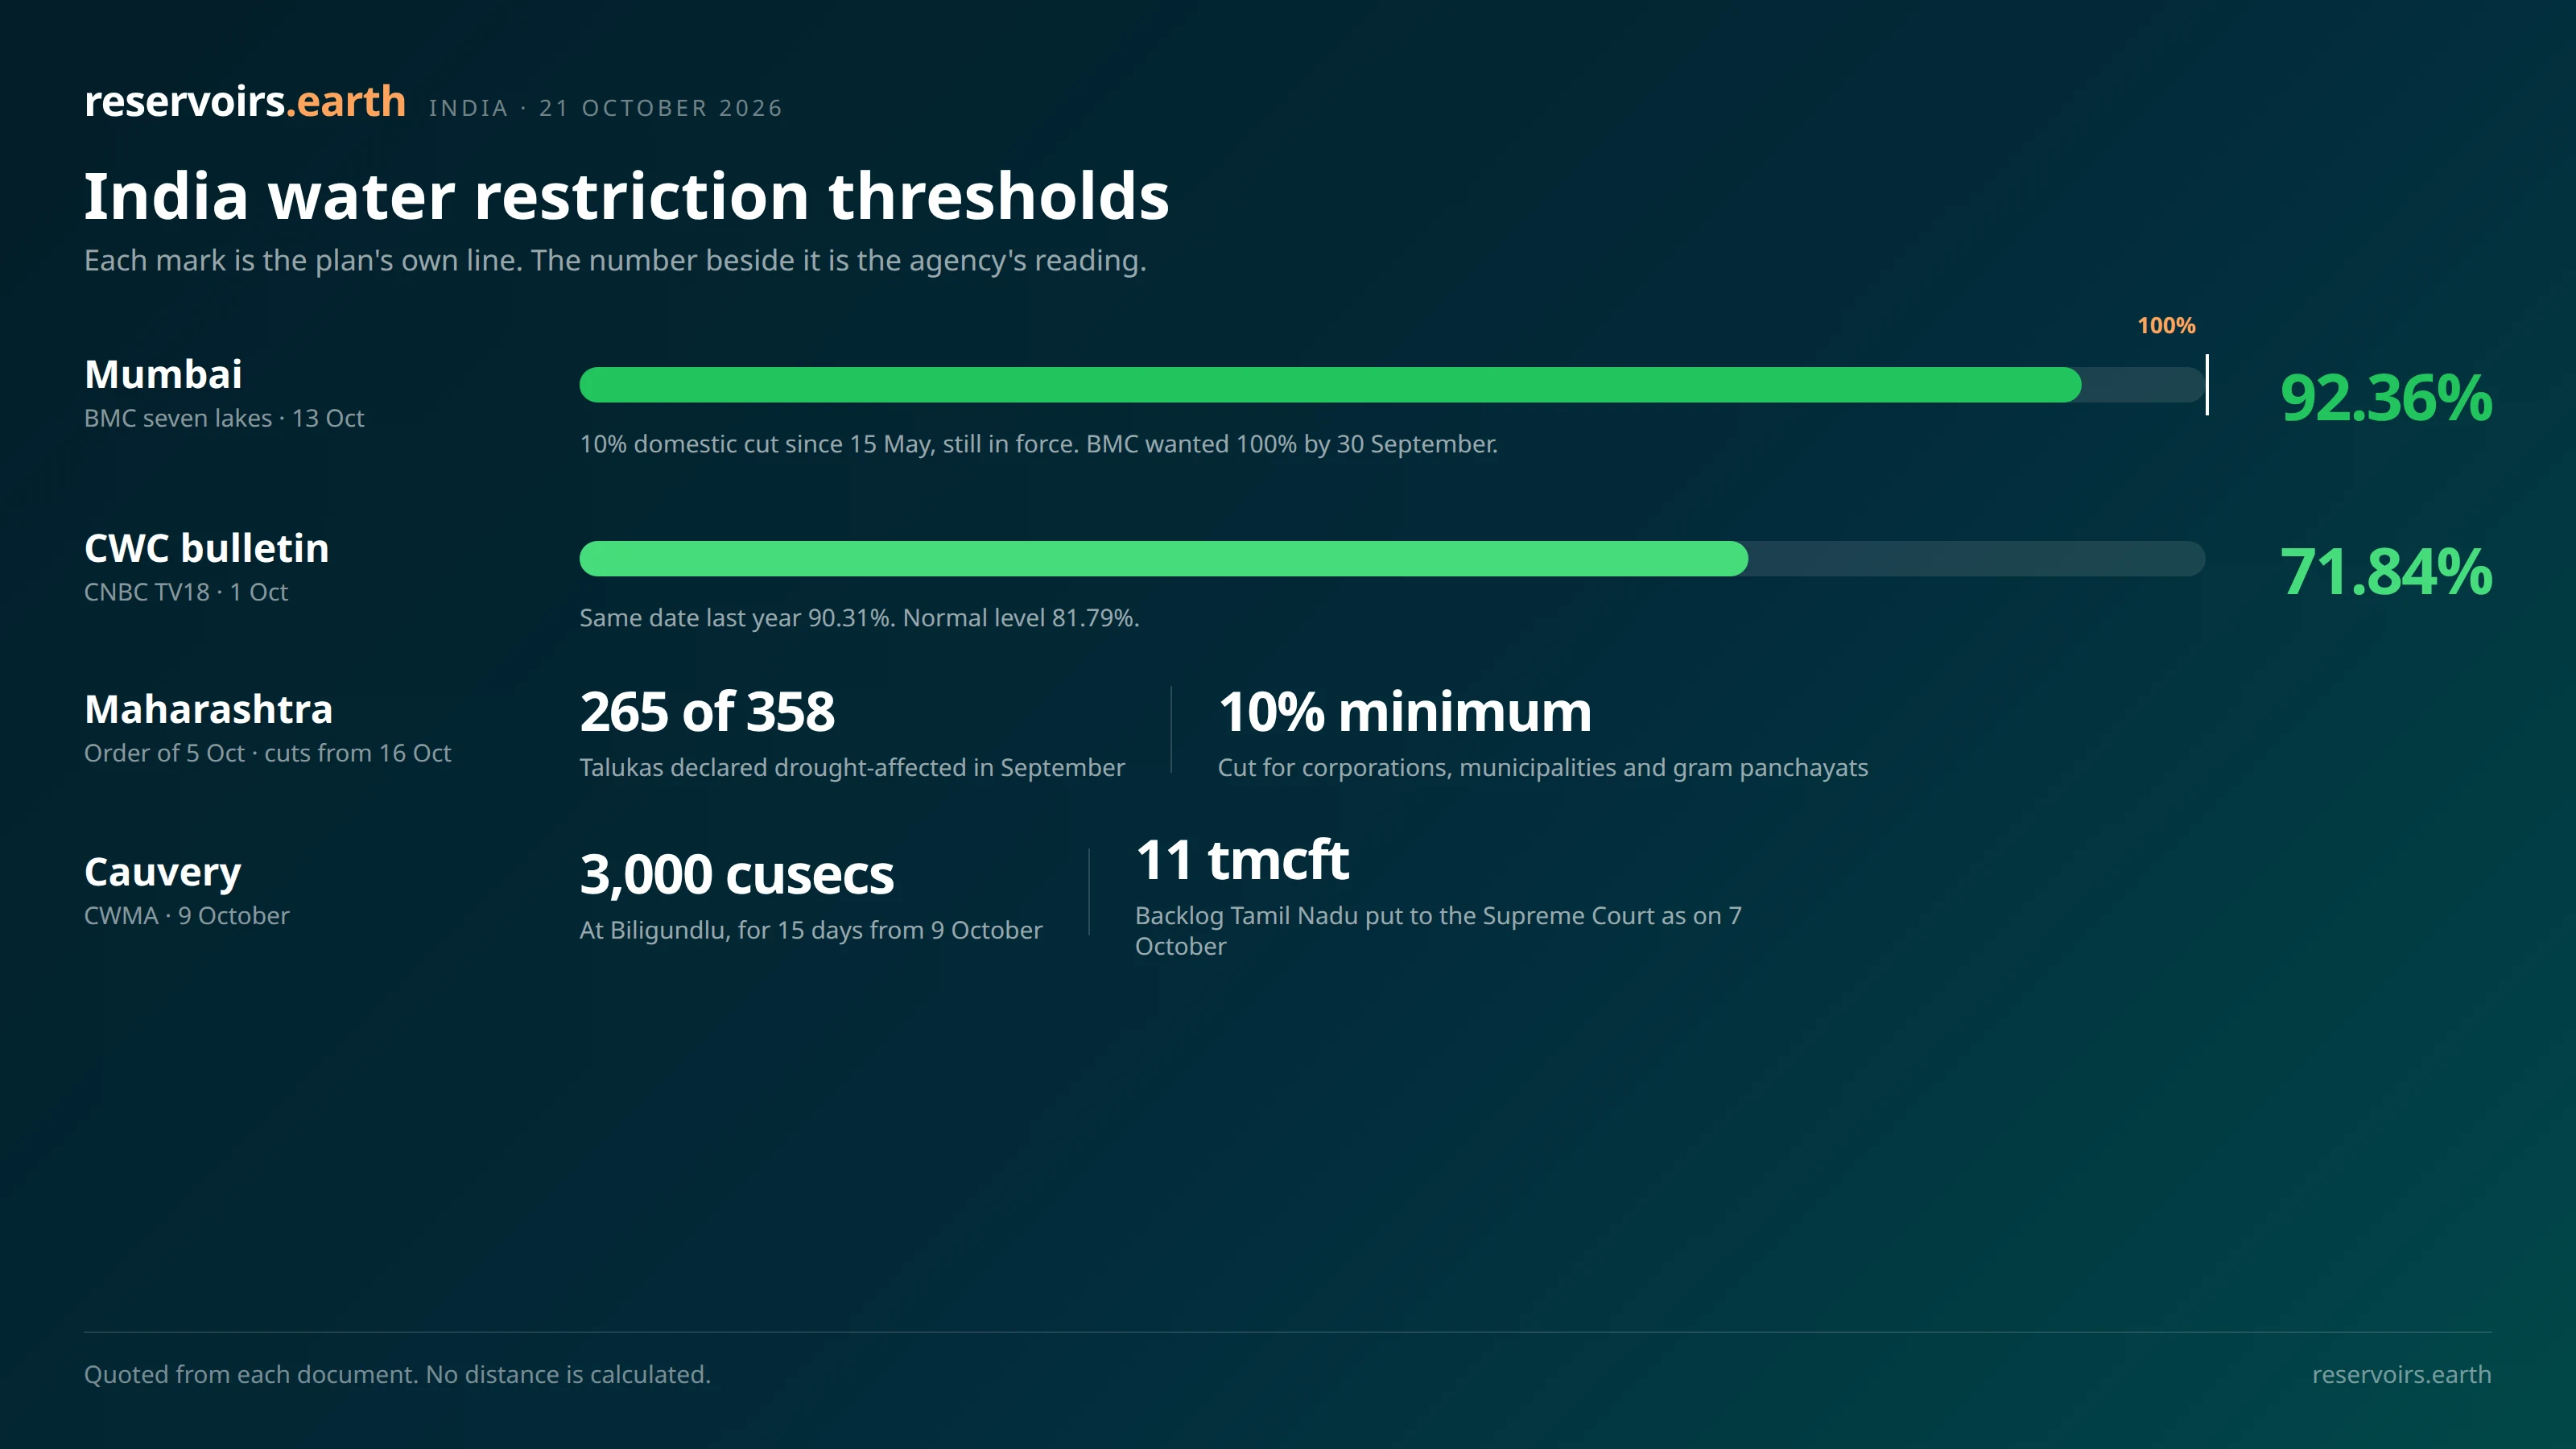
CNBC TV18, on 6 October, gave the national position as of 1 October as 71.84%, against 90.31% a year earlier and a normal level of 81.79%. The same article's state table, with Maharashtra and Rajasthan dated 5 October and the other rows dated 1 October:
| State or region |
Storage |
Same date last year |
Normal |
| India |
71.84% |
90.31% |
81.79% |
| Maharashtra (5 Oct) |
74.29% |
89.22% |
— |
| Rajasthan (5 Oct) |
61.93% |
— |
— |
| Andhra Pradesh |
35.14% |
88.60% |
71.85% |
| Karnataka |
59.98% |
89.16% |
80.42% |
| Kerala |
59.88% |
76.06% |
69.75% |
| Tamil Nadu |
37.27% |
91.96% |
66.00% |
| Telangana |
40.75% |
86.10% |
78.95% |
A dash is an empty cell in that table. The Hindu BusinessLine's 1 October report described the same week as 178 major reservoirs at nearly 72% of capacity.
Down To Earth, on 19 October, reported the bulletin of Thursday 15 October. The 178 reservoirs held 126.717 billion cubic metres, 68.58% of a combined live capacity of 184.762 billion cubic metres. That capacity is about 71.67% of an estimated national live storage of 257.812 billion cubic metres. Storage was 41.193 billion cubic metres, or 24.53%, lower than the same time last year, and 24.930 billion cubic metres, or 16.44%, below normal. Normal in that account is the average of the past 10 years.
The same report sorts basins by the bulletin's categories. Highly deficient: Pennar, a 72.32% deficit against normal storage, and the Cauvery, a 60.50% deficit. Deficient: Indus, Mahi, Krishna (32.59%), Sabarmati (38.03%), the Kutch–Saurashtra and Luni regions, the east-flowing rivers between Pennar and Kanyakumari, and the west-flowing rivers between Tadri and Kanyakumari. Close to normal: Ganga, Tapti, Godavari, Brahmaputra and Brahmani–Baitarani. Above normal: Narmada (7.81% above), Mahanadi (2.95% above) and Swarnarekha (30.74% above).
Down To Earth also listed individual reservoirs below half of normal storage on that bulletin. Aliyar in Tamil Nadu had no storage relative to its normal level. Somasila was at 22.05% of normal, Srisailam at 33.64%, Mettur at 32.49%, Idukki at 10.62%. In Maharashtra, Jaikwadi was at 15.55% of normal, Ujani at 10.62%, Manjra at 12.45% and Lower Terna at 28.24%. In Karnataka, Ghataprabha was at 22.56% of normal, Tungabhadra at 22.54% and Sholayar at 23.62%. Those percentages are shares of normal storage in the bulletin. They are not the percentage full on the reservoir pages linked below.
Table 3.8 of the drought manual
The Manual for Drought Management, 2020, treats reservoir storage as one hydrological indicator. Section 3.2.4.1 defines a Reservoir Storage Index from the percentage deficit against the long-term average, and points to Table 3.8.
The manual's formula is:
RSI = ((MRSi − RSij) × 100) / MRSi
MRSi is the mean reservoir storage for that month over 10 years, in cubic metres. RSij is the storage in that month of that year, in the same units.
Table 3.8, "Category of deficit based on % deficit in live storage volume of reservoir":
| % deficit in live storage volume, against the average of the last 10 years |
Category |
| Less than 20% |
Normal deficit |
| 20–30% |
Mild deficit |
| 30–40% |
Moderate deficit |
| 40–60% |
Severe deficit |
| More than 60% |
Extreme deficit |
The manual says the index is useful where agriculture depends on reservoir supplies, and that the Commission monitors selected major reservoirs only. It tells state governments to collect real-time data for minor and medium storages themselves. The bands above are the manual's categories. This page does not apply them to a bulletin total or to a single dam.
Mumbai
The Brihanmumbai Municipal Corporation draws the city from seven lakes: Upper Vaitarna, Modak Sagar, Tansa, Middle Vaitarna, Bhatsa, Vihar and Tulsi. The Indian Express, on 15 May, gave their combined capacity as 14.47 lakh million litres. That report spells Vihar as Vehar.
On 15 May the corporation started a 10% cut. The Indian Express that day put the stock at 3.17 lakh million litres, 22% of capacity, and the city's supply at 3,850 million litres a day. A 30 September report from the same paper says the cut was announced when stocks fell below 25%, after the India Meteorological Department projected a below-normal southwest monsoon.
Hindustan Times, on 5 September, dated the next step. On 17 June the corporation stopped supply to construction sites and swimming pools and imposed a 20% cut on industrial, commercial and recreational use. Supply to municipal swimming pools was restored on 16 August. The 20% cut on the other non-domestic users continued.
On 5 September the same paper said the seven reservoirs were around 95% full and that the corporation wanted them at 100% by 30 September before taking a call on lifting the cut. It named municipal commissioner Ashwini Bhide as the person who would make the final decision.
The Indian Express, on 30 September, reported Additional Municipal Commissioner Abhijit Bangar's statement to the civic house the previous day. The seven lakes were at 96.64% on that Tuesday. On the same day a year earlier they were at 97.57%, and the year before that at 99.09%. They had not reached 100%. Bangar said that with the 10% cut kept in place the stock would last until 17 May 2027, and that it should stay because of evaporation under the El Niño conditions the corporation was citing.
Hindustan Times, on 14 October, put the seven-lake stock at 92.36% on 13 October and the daily supply at 4,100 million litres. The cuts still in force were 10% for domestic supply and 20% for commercial and industrial users. Bangar pointed to carryover stock in the Bhatsa and Upper Vaitarna dams, which are state government reservoirs, as part of the city's position.
In 2024 the corporation lifted a 10% cut on 29 July, after stocks rose above 66%, with Vihar and Modak Sagar overflowing. That year the cut had been 5% from 30 May and 10% from 5 June. Hindustan Times, writing on 5 September 2026, said there was no similar cut in 2025.
Two of the seven lakes are on this site, from the Commission's readings, which are a different series from the corporation's combined stock. Bhatsa was 99.6% full on 24 September 2026. Upper Vaitarna was 98% full the same day. Those percentages are the live-storage figures on the reservoir pages. They are not the 92.36% seven-lake total.
Maharashtra
Hindustan Times, updated on 5 October, reported the state order. From 16 October, every municipal corporation, municipality and gram panchayat is to cut supply by at least 10%. The order also calls for a drive against leaks, sewage treatment plants at full capacity, and treated wastewater for gardens, construction and washing.
Water Resources Minister Girish Mahajan described the planning behind the order. The department has a dam-by-dam, use-by-use plan of available water out to 31 August 2027. Drinking water has the highest priority and is to be reserved to that date after evaporation, siltation and unauthorised extraction. Every reservoir is to keep an extra 10% as an emergency buffer. In extreme circumstances, dead storage may be used after a technical assessment. Industries must reuse or recycle at least 30% of the water they use. Irrigation water is allocated only after drinking water, livestock and fodder. Rabi foodgrain and fodder come first, then other rabi crops. Perennial crops are allocated water only if supplies remain.
The same report says drought has been declared in 265 talukas where the Trigger-1 criterion was applied for the 2026 kharif season. Down To Earth, on 13 October, gives the denominator: 265 of Maharashtra's 358 talukas, nearly 74% of them, declared in September.
Pune Municipal Corporation suspended city supply every Thursday from 15 October, to stretch reserves until August 2027. Down To Earth, citing the corporation, put the Khadakwasla system at 38.78 TMC on 13 October, against about 95% at the same point last year. The corporation's guidelines say drinking water should not be used for construction.
In Nagpur district, the District Disaster Management Authority prohibited new borewells and tubewells, and the deepening of existing ones, until further orders. Existing borewells may still be used. Government agencies are exempt. The order cites Section 51 of the Disaster Management Act, 2005.
In Chhatrapati Sambhajinagar, in Marathwada, the district administration told departments to keep a buffer of at least 10% of live storage in major reservoirs and to put drinking water first. Irrigation releases are restricted except where unavoidable. Industries there were told to reuse 30% of what they consume. Down To Earth quotes the state Water Resources Department's storage report of 13 October for that region: major projects at 58.34% of capacity, against 97.30% a year earlier; medium projects at 21.12%, against 76.23%; minor projects at 15.42%, against 66.70%. In Beed, five of eight dams had no water in storage. In Dharashiv, seven of nine irrigation schemes were dry, and Lower Terna was at 20.21%. In Nanded, six of nine projects had no water or less than 10%.
The Maharashtra page on this site reads 82.3% full. That is the capacity-weighted fill of the 35 reservoirs tracked there, from Commission readings dated 24 September to 19 October 2026. CNBC TV18's figure for the state, 74.29% on 5 October, is the bulletin total. The two cover different sets of reservoirs.
The Cauvery
The New Indian Express, on 9 October, reported the 59th meeting of the Cauvery Water Management Authority. The Authority directed Karnataka to release 3,000 cusecs of Cauvery water daily at Biligundulu for 15 days from 9 October, upholding the Cauvery Water Regulation Committee. The 13 October report of the court hearing spells the gauge Biligundlu.
The 9 October report, citing the Tamil Nadu water resources department, says the Supreme Court's final order requires Karnataka to release 127.0535 tmcft to Tamil Nadu in the current water year. Tamil Nadu had received 45.8508 tmcft as of 7 October. The department's deficit on that full-year quantity was 81.2027 tmcft. At the meeting, Tamil Nadu asked for its share on a pro-rata basis and sought 20 tmcft between 9 and 23 October.
On 13 October the New Indian Express reported the Supreme Court hearing of the previous day. A bench of Justices Vikram Nath and Aapresh Kumar Singh reserved its decision on Tamil Nadu's application. The application seeks a backlog of 11 tmcft as on 7 October, and 1.3 tmcft a day for 10 days, measured at Biligundlu. Karnataka told the court that meeting that demand is difficult in a rain-deficit year, with areas already declared drought-hit, and that drinking water has to be conserved. Tamil Nadu told the court it is seeking its pro-rata share together with the backlog, and that the burden of a distress year cannot be passed only to the lower state.
Tamil Nadu's case, as that report gives it, is that the share in a distress year has to be decided pro rata, and that the Authority has not formulated a distress formula in the eight years since it was constituted. The same account says an earlier direction was 4,000 cusecs at Biligundlu for 15 days from 24 September, reduced to 3,000 cusecs from 9 October. Tamil Nadu told the court that at the 24 September meeting the Regulation Committee found the flow realised at Biligundlu should have been 52.935 tmcft.
The Commission's readings on this site for the dams in that system, as percentage full on each reservoir page:
Mettur's 48.2% is percentage full on 24 September. The 15 October bulletin figure quoted by Down To Earth, 32.49% of normal storage, is a different measure on a later date.
Bengaluru and Chennai
Hindustan Times, updated on 6 July, reported prohibitory and regulatory orders from the Bangalore Water Supply and Sewerage Board under Sections 33 and 34 of the Bangalore Water Supply and Sewerage Act, 1964. The orders ban the use of drinking water for washing vehicles, gardening, construction, road works and road cleaning, decorative fountains, non-drinking use in malls and cinema halls, and filling or maintaining swimming pools. A pool used to train athletes for state or national competition is exempt if the board has given permission. A breach is a fine of ₹5,000 under Section 109, and ₹500 for each further day. Apartments, malls, offices, hotels, restaurants and public places, including religious institutions, were told to fit flow restrictors or aerators on cleaning taps by 31 July. Failing that, the board may cut supply by 50% under Section 53, with the same fines. Violations can be reported on 1916.
The orders name uses. They do not name a reservoir percentage at which a stage begins.
The board's storage figure in that report was 203 TMC as of Saturday evening, about 23% of 895.6 TMC. In the Cauvery basin the same statement gave 36 TMC against 114.5 TMC. The chairperson said the board was preparing to draw from Kabini and Hemavathi if needed. The later readings for those two dams are in the table above. The Karnataka page now reads 74.9%, the capacity-weighted fill of 18 reservoirs with Commission readings from 24 September to 19 October. CNBC TV18's bulletin figure for the state was 59.98% on 1 October.
For Chennai, no storage percentage that starts a current restriction was found in the documents used here.
The 2019 precedent is a record of what the city did when the reservoirs were empty, not a line in a current plan. Frontline reported the four freshwater reservoirs — Red Hills, Cholavaram, Poondi and Chembarambakkam — at 27 million cubic feet on 18 June, against a combined capacity of 11,257 million cubic feet, about 0.24%. It reported supply at around 525 million litres a day, against a normal 830 million litres a day. The Hindu reported that the Chennai Metro Water Supply and Sewerage Board told the Madras High Court the supply was cut to 525 million litres a day from 1 June 2019, from 830 million litres a day in a normal season, because of the rainfall deficit. On 16 June 2019 the four reservoirs held 27 million cubic feet against 11,257 million cubic feet: Poondi 26 million cubic feet of a capacity of 3,231, Cholavaram and Red Hills empty (capacities 1,081 and 3,300), Chembarambakkam 1 million cubic feet of 3,645.
Figures on this site
The India page reads 59.8% full. That is 140,928 million cubic metres stored against 235,779 million cubic metres of listed capacity for the reservoirs that have a current Commission reading. The newest of those readings is 20 October 2026. The page tracks 318 reservoirs. The bulletin's 71.84% and 68.58% are the Commission's live-storage totals for its own 178 reservoirs.
| Page |
Fill on this site |
Readings |
| India |
59.8% |
Newest reading 20 Oct 2026 |
| Maharashtra |
82.3% |
24 Sep–19 Oct 2026, 35 reservoirs |
| Karnataka |
74.9% |
24 Sep–19 Oct 2026, 18 reservoirs |
| Tamil Nadu |
38.2% |
8 Sep–20 Oct 2026, 24 of 36 reservoirs with a reading |
Where Down To Earth quoted a 15 October "percent of normal" and this site has a percentage full, both are listed. The columns are different measures.
| Reservoir |
This site, % full |
Date |
Bulletin, % of normal (15 Oct) |
| Srisailam |
27.5% |
19 Oct |
33.64% |
| Mettur |
48.2% |
24 Sep |
32.49% |
| Tungabhadra |
50.6% |
19 Oct |
22.54% |
| Aliyar |
4.2% |
24 Sep |
No storage relative to normal |
| Idukki |
58.9% |
20 Oct |
10.62% |
| Somasila |
25.2% |
19 Oct |
22.05% |
The September India edition has the state table from the start of that month. The same method of quoting a plan line and a reading separately is used for the United States and for Australia.
Sources and methodology
Sources were last checked on 21 October 2026. Where a row carries an earlier date, that is the date of the reading or the order. A sentence that describes what a cut requires is taken from the news report of the order. It is not a finding that the rule binds a particular customer today.
Bulletin percentages are quoted from the news report that cites the bulletin, in that report's units. Nothing is converted, no gap is computed, and the Reservoir Storage Index is not applied. A stage or a cut is named only when the report attributes it to the authority that ordered it.
- Bulletin, 1 October: CNBC TV18, 6 October 2026; The Hindu BusinessLine, 1 October 2026 (178 reservoirs). Commission bulletin page: cwc.gov.in/reservoir-level-storage-bulletin.
- Bulletin, 15 October: Down To Earth, 19 October 2026.
- Reservoir Storage Index: Ministry of Agriculture and Farmers Welfare and Ministry of Earth Sciences, Manual for Drought Management, 2020, section 3.2.4.1 and Table 3.8 (PDF).
- Mumbai: Indian Express, 15 May 2026 and 30 September 2026; Hindustan Times, 5 September 2026 and 14 October 2026.
- Maharashtra: Hindustan Times, 5 October 2026; Down To Earth, 13 October 2026.
- Cauvery: New Indian Express, 9 October 2026 and 13 October 2026.
- Bengaluru: Hindustan Times, 6 July 2026.
- Chennai, 2019: Frontline, "Chennai's thirst"; The Hindu, report of the Madras High Court hearing on the cut from 1 June 2019.
- This site: Central Water Commission readings held in the reservoir dataset, as shown on the linked pages on 21 October 2026.
Cite this page: reservoirs.earth, "India Water Restriction Thresholds: How Reservoir Levels Trigger Drought Alerts and Water Cuts", data as of 21 October 2026, https://reservoirs.earth/the-reservoir/india-water-restriction-thresholds.
Related: What dam level starts water restrictions in Australia? · How close is your city to water restrictions? · India reservoir levels, September 2026 · Reservoir Transparency Index.