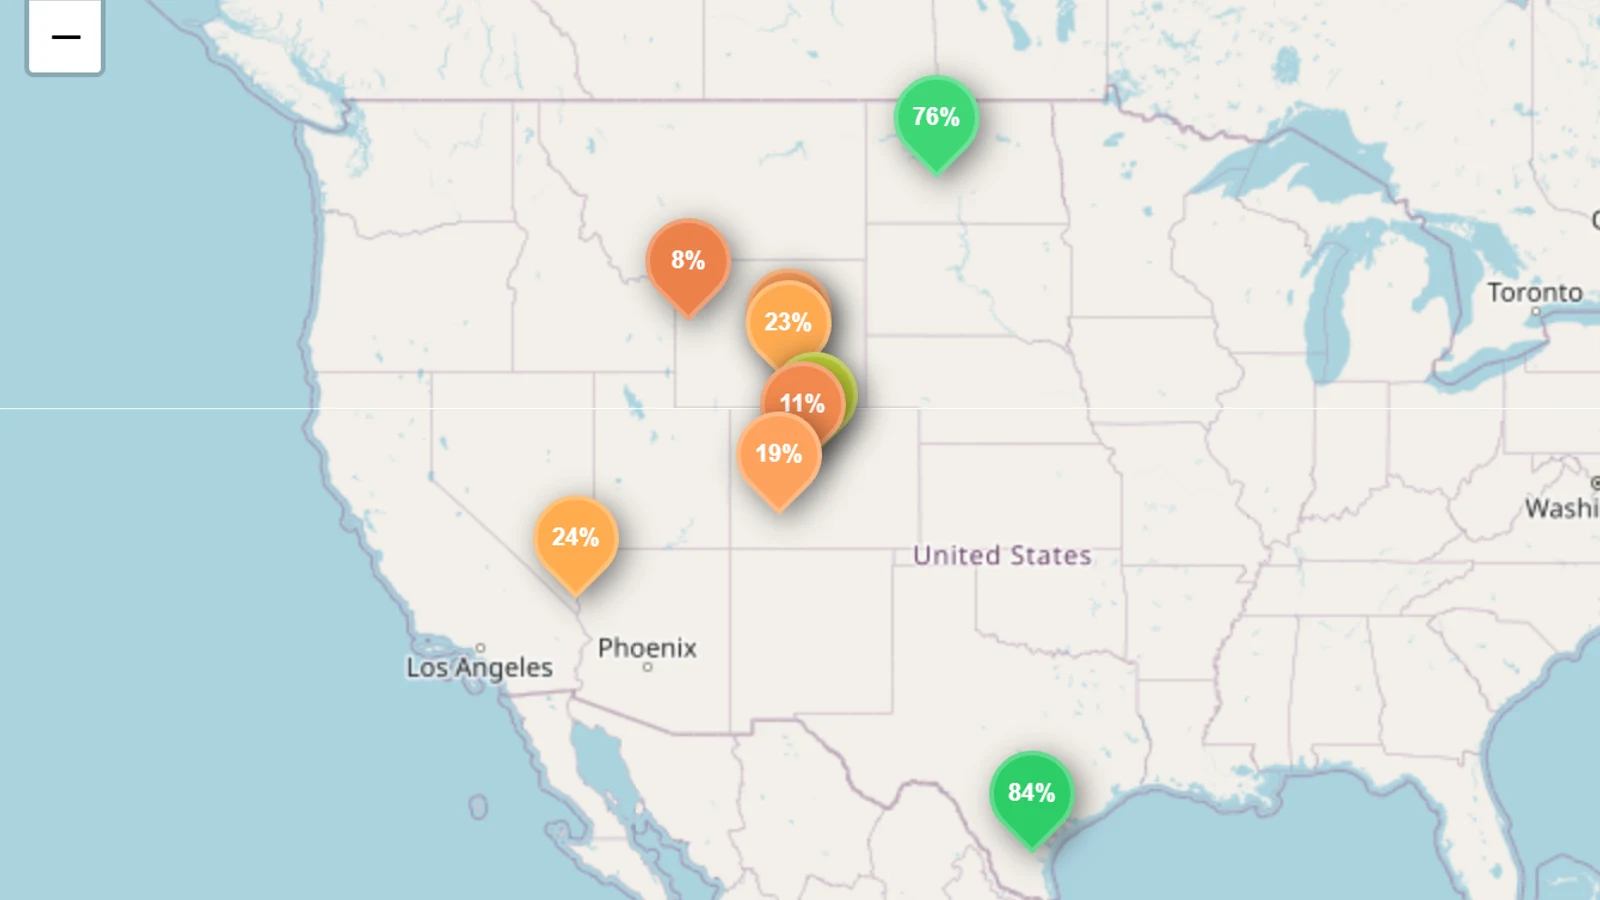
Across a fixed basket of 309 US reservoirs with a reading near 2 October in every year from 2022 to 2026, storage stood at 53.6% of capacity in early October 2026. That matches the 53.4% of early October 2022 and sits well below the wetter Octobers of 2023 (65.7%), 2024 (63.0%) and 2025 (58.8%). Against the 4-year average for the same date (2022–2025), the country is 6.6 points below.
The wider live network is larger: 537 reporting reservoirs across 37 states held 56.1% of capacity. The year-by-year comparison below uses only the like-for-like set, so a growing feed cannot flatter 2026.
Key takeaways
- Early October 2026 is the joint-lowest in five years on this basket: 53.6%, essentially tied with 2022’s 53.4%, and 12.1 points below the 2023 peak.
- Each October since 2023 has been thinner than the last on the same dams: 65.7% → 63.0% → 58.8% → 53.6%.
- The gap with last year is 5.2 points (53.6% vs 58.8%). The gap with the 4-year October average (60.2% across 2022–2025) is 6.6 points.
- Colorado remains furthest below its 4-year October average: 45.3% against 68.3% (−23.0 pts). Blue Mesa is 19.2% against a 63.0% 4-year October average.
- Only four comparable states are at or above their 4-year October average: Kansas (+3.4), California (+1.7), Louisiana (+0.9) and Washington (+0.2).
Early October, year by year
Same 309 reservoirs, same capacity weights, reading nearest to 2 October each year (within five days):
| Date |
Fill |
Stored |
Capacity |
| ~2 Oct 2022 |
53.4% |
140 km³ |
263 km³ |
| ~2 Oct 2023 |
65.7% |
173 km³ |
263 km³ |
| ~2 Oct 2024 |
63.0% |
166 km³ |
263 km³ |
| ~2 Oct 2025 |
58.8% |
155 km³ |
263 km³ |
| ~2 Oct 2026 |
53.6% |
141 km³ |
263 km³ |
2023 was the high-water mark after a wet western snowpack. 2026 has given that back: stored volume on this basket is about 32 km³ below early October 2023 and only 0.6 km³ above early October 2022. The story is not a sudden collapse in the last week of September — it is a three-year glide from the 2023 peak back to drought-era October levels.
Reservoir levels by state vs their own October history
Every percentage is capacity-weighted. For each state, 4-yr Oct avg is the capacity-weighted mean of early-October levels in the last four years (2022–2025) on the same dams used for 2026.
Fifteen of these 18 states are below their own 4-year October average. The western deficit that led the September edition is still the main pattern; Kansas and California are the clear above-average exceptions among larger baskets.
Colorado and Wyoming still set the shortfall
Colorado’s early-October year-by-year path on this basket is steep: 60.5% (2022) → 78.1% (2023) → 72.6% (2024) → 61.8% (2025) → 45.3% (2026). The state is not only below its 4-year October average — it is below every early October in the series.
Named reservoirs behind that number:
- Blue Mesa — 19.2% against a 63.0% 4-year October average (−43.8 pts). Year path: 38.7% → 83.5% → 74.5% → 55.4% → 19.2%.
- Green Mountain — 10.8% against 65.4%.
- Lake Granby — 49.4% against 87.1%.
Wyoming tells the same upstream story. Jackson Lake is 8.1% against a 55.9% 4-year October average (path: 16.6% → 65.8% → 76.7% → 64.3% → 8.1%). Pathfinder is 16.9% against 45.5%; Seminoe is 23.2% against 51.8%.
Absolute fill and the anomaly still diverge
North Dakota is again the clearest example. Its comparable reservoirs are 75.3% full — higher than most western states — yet 17.4 points below their 4-year early-October average near 93%. Garrison is 75.8% against a 94.0% 4-year October average (path: 90.3% → 100.8% → 97.9% → 86.8% → 75.8%).
Washington sits at only 19.0% full, but that matches its 4-year early-October average on this basket (+0.2 pts). A low seasonal operating level is not the same as an unusual shortage.
Lake Mead is 24.2% against a 29.4% 4-year October average — below every early October in the series (26.0% → 31.4% → 30.8% → 29.2% → 24.2%), but the national shortfall is driven more by the Rockies and the Upper Missouri than by Mead alone. Live Mead figures stay on the Lake Mead water level page.
How we calculated the comparison
For each reservoir we took the reading nearest to 2 October in each year 2022–2026, within a five-day window. A reservoir enters the national and state tables only if it has a qualifying reading in all five years. Aggregation is capacity-weighted throughout. The 4-year October average for a reservoir or state is the mean of its 2022–2025 early-October fills, then capacity-weighted across dams — so a year with more daily readings does not dominate.
That leaves 309 reservoirs in 18 states (plus a one-reservoir Louisiana row). States outside the table either lack five-year early-October coverage in our seeds or are not covered by the federal and state feeds we ingest. This is a recent five-year same-date series, not a 30-year climatology and not a survey of all US dams.
Sources are USGS NWIS, the Bureau of Reclamation, USACE CWMS, California’s CDEC, SRP and the other official feeds listed in How we get our data: United States. Live figures are on the United States reservoir map, and US data openness is assessed in the Reservoir Transparency Index. This updates the September 2026 state comparison.