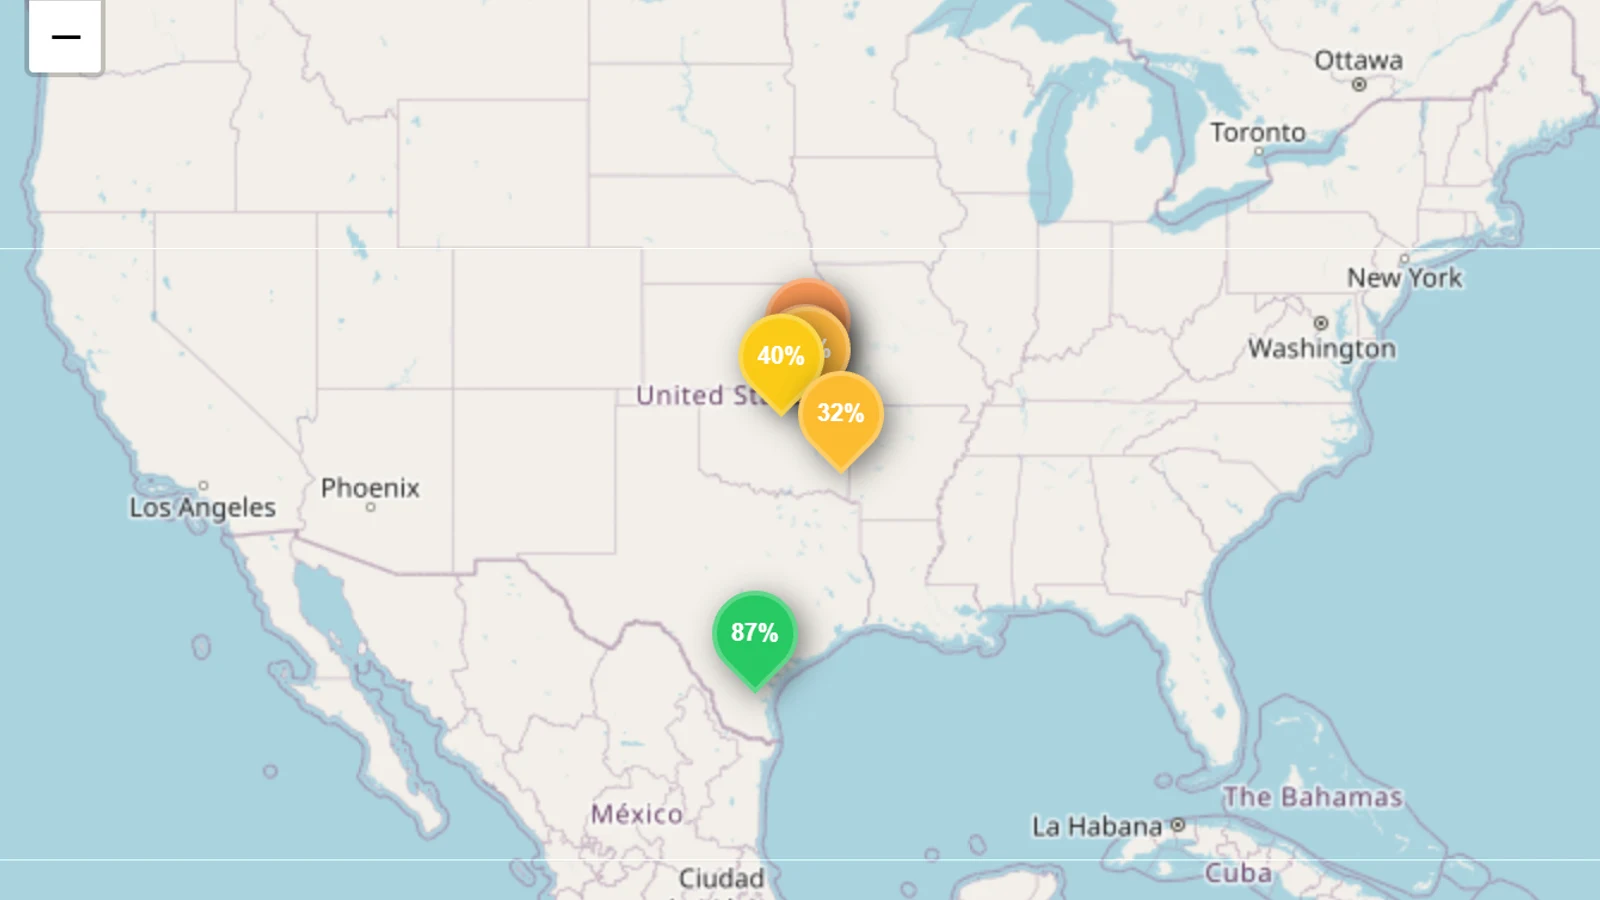
Toronto Lake in Kansas went from 33.5% full on 25 June 2026 to 82.2% the next day — 43 hm³ to 106 hm³ — and hit 100% on 27 June. No other US reservoir we track of real size moved that far in 24 hours this year and stayed there. The same late-June storms then filled a string of Oklahoma flood-control lakes. In August, Lake Corpus Christi did the slow version of the same trick: 36.8% on 31 July to 86.5% on 7 August, the largest seven-day volume gain among these fast fills. Daily USGS readings are on each dam page; the national picture is on the United States page.
Key takeaways
- Toronto Lake is the fastest one-day fill of 2026 among reservoirs over 20 hm³: +48.7 points on 26 June, full on the 27th.
- The southern plains filled as a group. Hulah, Copan and Kaw in Oklahoma all reached 96–100% in the last week of June.
- Kaw moved the most water: +381 hm³ between 20 and 27 June, then 100% on the 29th.
- Lake Corpus Christi is the August case — +158 hm³ in seven days, 91% by 10 August, from a spring low of 8.5%.
- Flood-control lakes do not stay full. Toronto was already back to 62% by 2 July. The number that matters is the pulse, not the carryover.
One day: Toronto, then Oklahoma
On 25 June, Toronto Lake held 43 hm³, 33.5% of its 129 hm³ conservation pool. On 26 June it held 106 hm³, 82.2%. On 27 June it was full. That is a 49-point day and a 66-point weekend. The lake then did what a Kansas flood-control pool is built to do: it released. By 2 July it was 61.5%.
The same weather hit Oklahoma a few hours later.
| Reservoir |
Jump |
Fill after the jump |
Next day |
| Toronto, Kansas |
25–26 Jun: 33.5% → 82.2% |
100% on 27 Jun |
Still 99% on 28 Jun |
| Wister, Oklahoma |
6–7 Jun: 45.6% → 82.6% |
93.6% on 8 Jun |
Held the 90s |
| Hulah, Oklahoma |
25–26 Jun: 50.9% → 81.0% |
95.9% on 27 Jun, 100% on 28 Jun |
99.6% on 29 Jun |
| Copan, Oklahoma |
26–27 Jun: 53.5% → 84.2% |
96.9% on 28 Jun, 100% on 29 Jun |
99.2% on 30 Jun |
Wister is the earlier pulse, 6–8 June. Hulah, Copan and Toronto are the same late-June storm. None of these readings reverse the next morning, which is how a bad gauge looks in this dataset. They hold.
One week: Kaw and Corpus Christi
Kaw Lake is the large one. From 49.5% on 20 June to 88.3% on 27 June it added 381 hm³ — more water than Toronto, Hulah and Copan hold between them. It was 100% on 29 June. Capacity is 984 hm³. A 50-point week on a reservoir that size is a different class of event from a 49-point day on a 129 hm³ lake.
Lake Corpus Christi is the other week, and it is not a flood pulse. It climbed almost in a straight line: 36.8% on 31 July, 58.4% on 3 August, 86.5% on 7 August, 90.9% on 10 August. That is +158 hm³ in seven days, in a 317 hm³ reservoir that had sat at 8.5% in April. In 2023, 2024 and 2025 it fell across the same midsummer window. The summer movers piece ranked it on the 90-day move. The daily series is what shows it filled in a week.
How to read a one-day fill
A percentage here is storage against the conservation pool in the National Inventory of Dams. Readings above 100% are the flood pool in use, not a broken number — Elk City in the same Kansas week went to 105%. And a reservoir that fills in a day on the southern plains is usually taking a storm, then giving the water back. Toronto's week after 27 June is the release. Corpus Christi's August is the exception: it kept the water.
The live figures sit on the United States reservoir map and on each dam page above. How those USGS and Bureau series are pulled is in How we get our data: United States.