Burguillo - Puente Nuevo
Tajo
Capacity
201 hm³
Coordinates
40.425°N, 4.578°W
Operator
Tajo
41.8% full
Current fill
41.8%vs 13 Oct 2026
-1.5 pplosing
vs 1 year ago
-5.5 ppyear-over-year
Trend
↓falling
Drought context
Storage vs October average
103%of normal
41.8% full on 2026-10-19, against an average of 40.7% for October across 9 years of readings (+1.1 points).
Rain over the last three months · 11 October 2026
Near normal
In the three months to 11 October 2026 the area around Burguillo - Puente Nuevo had rain close to normal for the season. Rainfall compared with the long-run record for the same season at this point (Copernicus Global Drought Observatory, SPI-3 index −0.99). Rain, not storage.
EU drought indicator · 11 October 2026
Noneno drought signal
The European Drought Observatory's combined reading of rain, soil moisture and vegetation at this point. Watch means rain has been short, Warning that the soil has dried out, Alert that vegetation is visibly stressed; Recovery means the shortfall is easing. Ground conditions, not the reservoir's storage. Spain drought figures →
Catchment Weather
Past 30 days + 14-day forecast · Open-Meteo
Technical specifications
| Total capacity | 201 hm³ |
| Primary use | — |
| Operator | Tajo |
| River basin | Tajo |
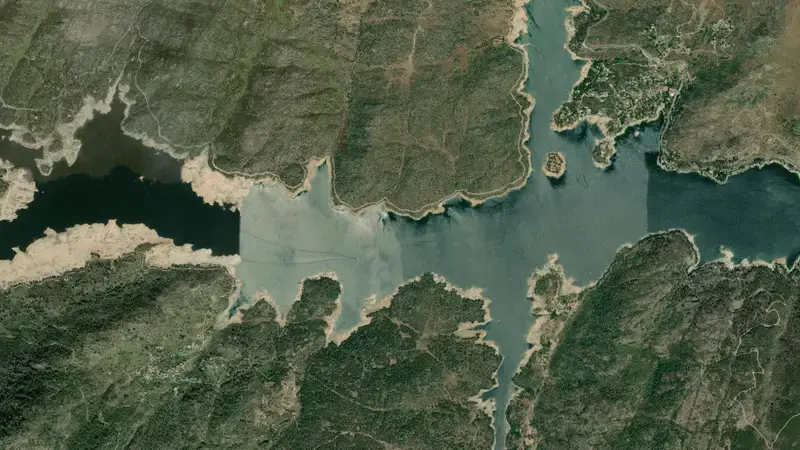
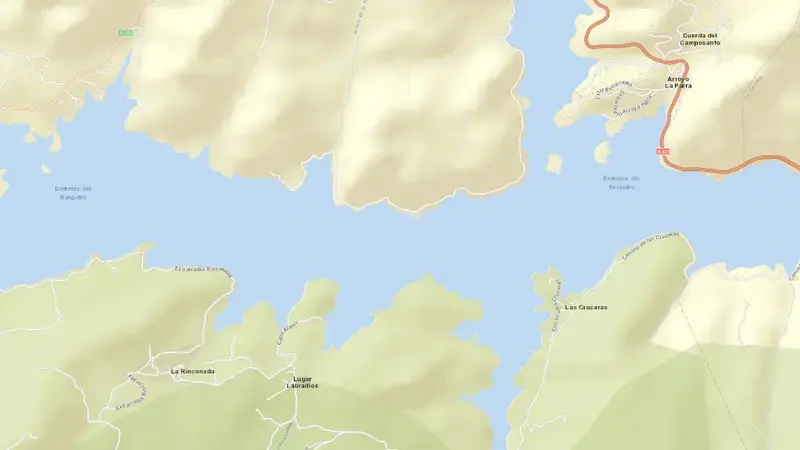
Satellite imagery: Esri, Maxar, Earthstar Geographics. Map: Esri, HERE, Garmin, © OpenStreetMap contributors. 40.425°N, 4.578°W · Open in Google Maps
About Burguillo - Puente Nuevo
As of October 19, 2026, Burguillo - Puente Nuevo is filled to 41.8% of its total capacity, holding 84 hm³ of water out of a maximum 201 hm³. At this level the reservoir is within its normal operating range.
Since October 13, 2026 the fill level has fallen by 1.5 percentage points, and it is 5.5 points below its level on the same date a year earlier.
Across the readings we hold for Burguillo - Puente Nuevo — 419 data points between October 16, 2018 and October 19, 2026 — the level has ranged from a low of 11.9% (November 19, 2019) to a high of 95.0% (June 3, 2025). On average the reservoir is fullest around May and at its lowest around October.
It is operated by Tajo. It lies within the Tajo basin at 40.425°N, 4.578°W.
Key facts
- Current fill level
- 41.8% of total capacity
- Water stored
- 84 hm³
- Total capacity
- 201 hm³
- Change since October 13, 2026
- ▼ 1.5 pp
- Year-on-year
- ▼ 5.5 pp
- River basin
- Tajo
- Operator
- Tajo
- Coordinates
- 40.425°N, 4.578°W
- Last updated
- October 19, 2026
Recent readings
| Date | Fill level | Volume (hm³) |
|---|---|---|
| 19 Oct 2026 | 41.8% | 84 |
| 13 Oct 2026 | 43.3% | 87 |
| 6 Oct 2026 | 44.3% | 89 |
| 29 Sep 2026 | 44.3% | 89 |
| 22 Sep 2026 | 46.3% | 93 |
| 15 Sep 2026 | 48.3% | 97 |
| 8 Sep 2026 | 50.2% | 101 |
| 1 Sep 2026 | 52.2% | 105 |
| 25 Aug 2026 | 53.7% | 108 |
| 18 Aug 2026 | 54.2% | 109 |
| 11 Aug 2026 | 54.7% | 110 |
| 4 Aug 2026 | 58.2% | 117 |