Dam · KwaZulu-Natal · South Africa · DWS
Zaaihoek Dam
99.1% full
Total capacity
184.3 hm³
River
Slang River
Basin
Pongola-Mtamvuna
Primary use
water supply
Reported
November 2, 2026
Current fill
99.1%vs 7 days ago
-1.8 pplosing
vs 1 year ago
N/A7-day trend
↓falling
Drought context
South Africa drought →Rainfall, last 3 months
Near normal
SPI-3 +0.04 · to 21 Oct 2026
Drought figures describe the ground around the reservoir, not its storage. Sources: Copernicus GDO (SPI-3).
Recent readings
| Date | Fill level | Volume (hm³) |
|---|---|---|
| 2 Nov 2026 | 99.1% | 182.6 |
| 26 Oct 2026 | 100.9% | 185.9 |
| 19 Oct 2026 | 100.9% | 186 |
| 12 Oct 2026 | 100.9% | 186 |
| 5 Oct 2026 | 100.9% | 186 |
| 21 Sep 2026 | 100.8% | 185.8 |
| 31 Aug 2026 | 100.5% | 185.2 |
| 24 Aug 2026 | 100.5% | 185.2 |
| 17 Aug 2026 | 100.5% | 185.2 |
| 10 Aug 2026 | 100.5% | 185.2 |
| 3 Aug 2026 | 100.5% | 185.2 |
| 27 Jul 2026 | 100.5% | 185.2 |
Weekly storage
Fill history — multi-year
On the map
Zoom out for the other countries we track · click one to open itLoading map…
Technical specifications
| Coordinates | 27.439°S, 30.060°E |
About this dam
Data source
official
Storage data: Department of Water and Sanitation (DWS) Weekly State of Dams report, South Africa.
Catchment Weather
Past 30 days + 14-day forecast · Open-Meteo
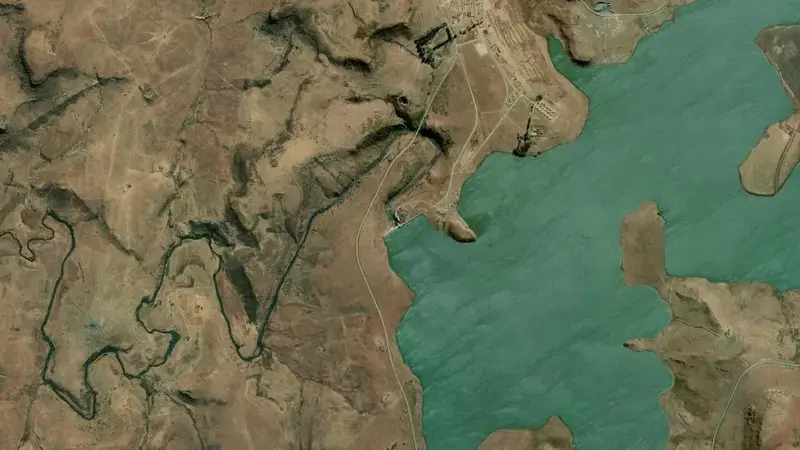
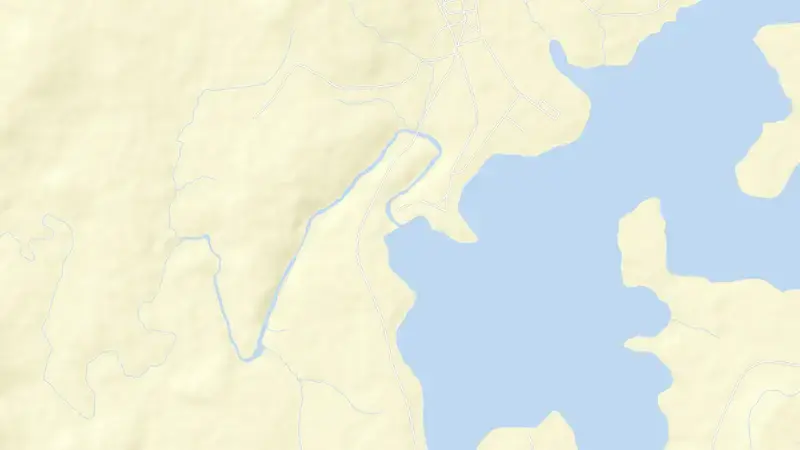
Satellite imagery: Esri, Maxar, Earthstar Geographics. Map: Esri, HERE, Garmin, © OpenStreetMap contributors. 27.439°S, 30.060°E · Open in Google Maps
About Zaaihoek Dam
As of November 2, 2026, Zaaihoek Dam is filled to 99.1% of its total capacity, holding 182.6 hm³ of water out of a maximum 184.3 hm³. At this level the reservoir is high.
Over the most recent week on record the fill level has fallen by 1.8 percentage points.
Across the readings we hold for Zaaihoek Dam — 21 data points between October 19, 2025 and November 2, 2026 — the level has ranged from a low of 99.1% (November 2, 2026) to a high of 100.9% (October 5, 2026). On average the reservoir is fullest around October and at its lowest around November.
It is operated by DWS South Africa primarily for water supply. It lies within the Pongola-Mtamvuna basin at 27.439°S, 30.060°E.
Nearby reservoirs
See also: South Africa dam levels, explained — how the DWS Weekly State of Dams report becomes the national and provincial figures.