
Dam · Eastern Cape · South Africa · DWS
Gubu Dam
100.1% full
Total capacity
8.52 Mm³
River
Gubu River
Basin
Unknown
Primary use
water supply
Operator
DWS South Africa
Coordinates
-32.610°S, 27.279°E
Last updated
2026-08-31
Current fill
100.1%vs 7 days ago
-0.2%losing
vs 1 year ago
N/A7-day trend
→stable
Weekly storage
Fill history — multi-year
About this dam
Data source
official
Storage data: Department of Water and Sanitation (DWS) Weekly State of Dams report, South Africa.
Catchment Weather
Past 30 days + 14-day forecast · Open-Meteo
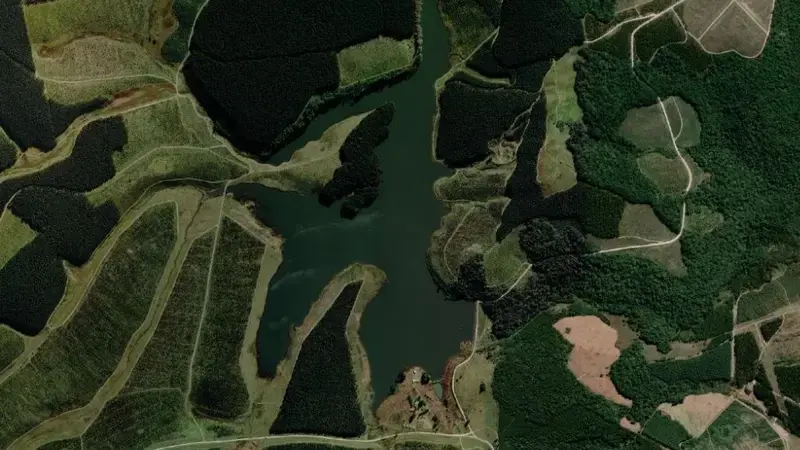
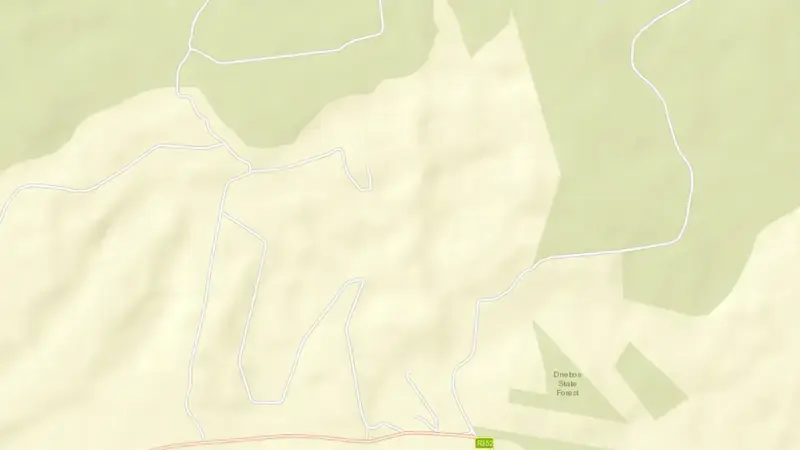
Satellite imagery: Esri, Maxar, Earthstar Geographics. Map: Esri, HERE, Garmin, © OpenStreetMap contributors. -32.610, 27.279 · Open in Google Maps
About Gubu Dam
As of August 31, 2026, Gubu Dam is filled to 100.1% of its total capacity, holding roughly 9 Mm³ of water out of a maximum 9 Mm³. At this level the reservoir is effectively full.
Over the most recent week on record the fill level has held broadly steady (-0.2 pts).
Across the readings we hold for Gubu Dam — 14 data points between May 31, 2026 and August 31, 2026 — the level has ranged from a low of 98.5% (June 3, 2026) to a high of 100.6% (August 10, 2026).
It is operated by DWS South Africa primarily for water supply. It lies within the Unknown basin at 32.610°S, 27.279°E.
Key facts
- Current fill level
- 100.1%
- Water stored
- 9 Mm³
- Total capacity
- 9 Mm³
- 7-day change
- ▼ 0.2 pts
- Primary use
- Water supply
- River
- Gubu River
- River basin
- Unknown
- Operator
- DWS South Africa
- Coordinates
- 32.610°S, 27.279°E
- Last updated
- August 31, 2026
Recent readings
| Date | Fill level | Volume (Mm³) |
|---|---|---|
| 31 Aug 2026 | 100.1% | 9 |
| 24 Aug 2026 | 100.3% | 9 |
| 17 Aug 2026 | 100.5% | 9 |
| 10 Aug 2026 | 100.6% | 9 |
| 3 Aug 2026 | 100.5% | 9 |
| 27 Jul 2026 | 99.2% | 9 |
| 29 Jun 2026 | 99.9% | 9 |
| 22 Jun 2026 | 99.7% | 9 |
| 16 Jun 2026 | 100.1% | 9 |
| 9 Jun 2026 | 100.1% | 9 |
| 8 Jun 2026 | 98.5% | 9 |
| 7 Jun 2026 | 98.5% | 9 |
Nearby reservoirs
See also: South Africa dam levels, explained — how the DWS Weekly State of Dams report becomes the national and provincial figures.