Reservoir · Uttarakhand · India · CWC · CENTRAL region
Nanak Sagar
79.1% of gross capacity
Gross capacity
6.2 TMC (176 MCM)
Live capacity
6.2 TMC (176 MCM)
Primary use
multiple
Operator
CWC
Coordinates
28.942°N, 79.829°E
Last updated
2026-09-24
Capacity in TMC
Nanak Sagar has a gross capacity of 6.2 TMC (176 MCM); it is currently at 79.1% of gross capacity, holding 4.9 TMC (139 MCM).
- Gross capacity
- 6.2 TMC (176 MCM)
- Live capacity
- 6.2 TMC (176 MCM)
- Current storage
- 4.9 TMC (139 MCM)
TMC is thousand million cubic feet, the unit used in Indian water reporting. 1 TMC = 28.3168 million cubic metres (MCM). Figures are converted from CWC, which publishes million cubic metres. The percentage is labelled live or gross only when the stored volume matches that capacity.
Current fill
79.1%vs 7 days ago
Stale7-day trend
StaleDrought context
Storage vs September average
110%of normal
79.1% full on 2026-09-24, against an average of 72.0% for September across 4 years of readings (+7.1 points).
Rain over the last three months · 11 October 2026
Near normal
In the three months to 11 October 2026 the area around Nanak Sagar had rain close to normal for the season. Rainfall compared with the long-run record for the same season at this point (Copernicus Global Drought Observatory, SPI-3 index +0.40). Rain, not storage. India drought figures →
Weekly storage
Fill history — multi-year
About this reservoir
Data source
official
Storage data: CWC. CWC region: CENTRAL.
Catchment Weather
Past 30 days + 14-day forecast · Open-Meteo
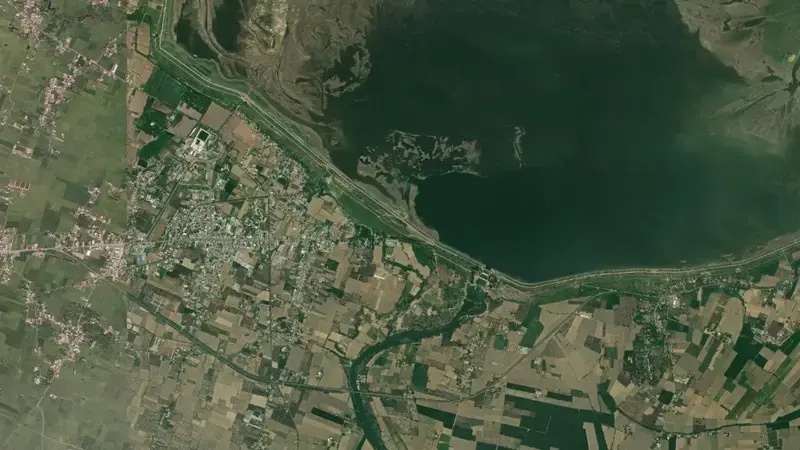
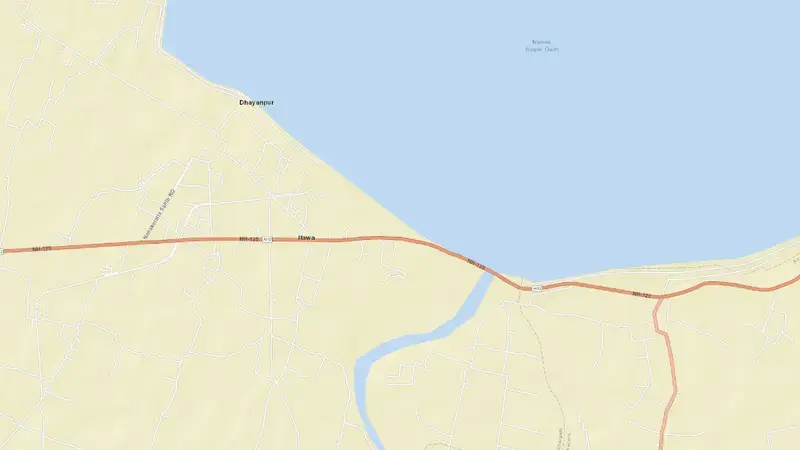
Satellite imagery: Esri, Maxar, Earthstar Geographics. Map: Esri, HERE, Garmin, © OpenStreetMap contributors. 28.942°N, 79.829°E · Open in Google Maps
About Nanak Sagar
As of September 24, 2026, Nanak Sagar is filled to 79.1% of its gross capacity, holding 4.9 TMC (139 MCM) of a gross 6.2 TMC (176 MCM). The reading is past the freshness window, so it is shown as stale.
The 7-day change is not shown, because the latest reading is past the freshness window.
Across the readings we hold for Nanak Sagar — 167 data points between June 8, 2023 and September 24, 2026 — the level has ranged from a low of 0.0% (June 8, 2023) to a high of 88.1% (October 23, 2025). On average the reservoir is fullest around November and at its lowest around June.
It is operated by CWC primarily for multiple purposes. It is at 28.942°N, 79.829°E.
Key facts
- Current fill level
- 79.1% of total capacity
- Water stored
- 4.9 TMC (139 MCM)
- Total capacity
- 6.2 TMC (176 MCM)
- 7-day change
- Stale
- Primary use
- Multipurpose
- Operator
- CWC
- Coordinates
- 28.942°N, 79.829°E
- Last updated
- September 24, 2026
Recent readings
| Date | Fill level | Volume (hm³) |
|---|---|---|
| 24 Sep 2026 | 79.1% | 139 |
| 17 Sep 2026 | 73.2% | 129 |
| 10 Sep 2026 | 69.6% | 122 |
| 3 Sep 2026 | 64.0% | 113 |
| 27 Aug 2026 | 55.4% | 97 |
| 20 Aug 2026 | 46.0% | 81 |
| 13 Aug 2026 | 31.8% | 56 |
| 6 Aug 2026 | 26.1% | 46 |
| 30 Jul 2026 | 19.0% | 33 |
| 23 Jul 2026 | 14.4% | 25 |
| 16 Jul 2026 | 6.5% | 11 |
| 9 Jul 2026 | 2.3% | 4 |