
Reservoir · Western Australia · Australia · BOM Water Data Online
Churchman Brook
45.7% full
Capacity
2.2 hm³
Volume stored
1 hm³
River
Churchman Brook
Year completed
1928
Coordinates
32.153°S, 116.082°E
Last updated
2026-09-06
Current fill
45.7%vs 7 days ago
+1.1%gaining
vs 1 year ago
-7.1%year-over-year
7-day trend
→stable
Data source: Bureau of Meteorology — Water Data Online (KiWIS) — daily mean storage volume, quality-controlled. Capacity from the BOM Water Storages ArcGIS layer (total design capacity in ML). Last reading: 2026-09-06.
Catchment Weather
Past 30 days + 14-day forecast · Open-Meteo
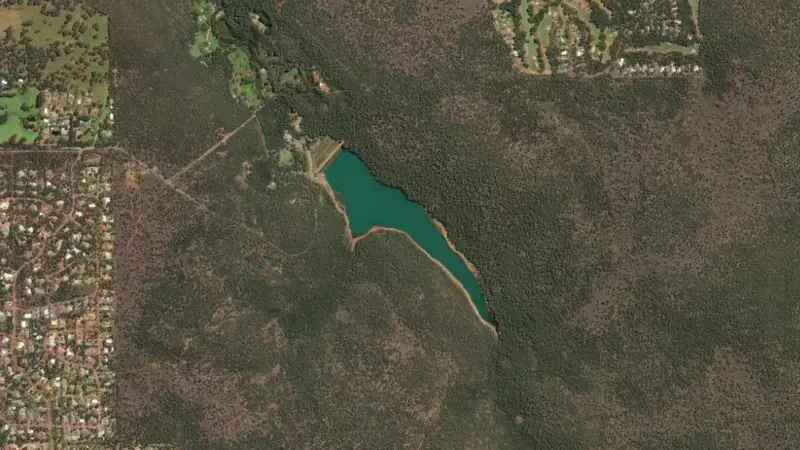
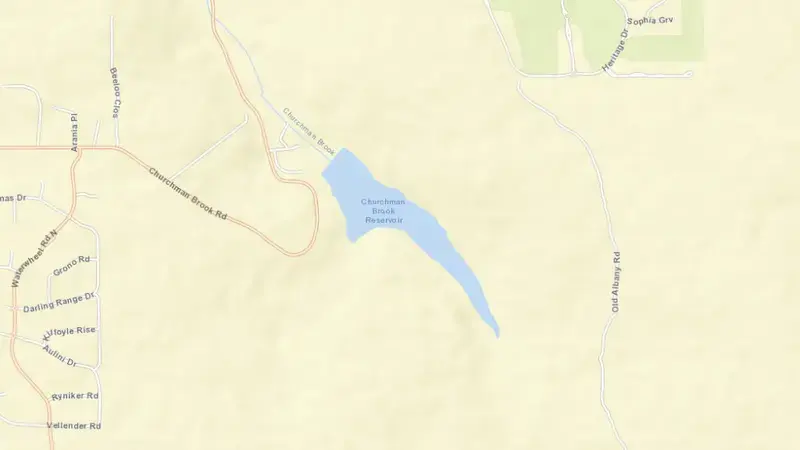
Satellite imagery: Esri, Maxar, Earthstar Geographics. Map: Esri, HERE, Garmin, © OpenStreetMap contributors. -32.153, 116.082 · Open in Google Maps
About Churchman Brook
As of September 6, 2026, Churchman Brook is filled to 45.7% of its total capacity, holding roughly 1 hm³ of water out of a maximum 2 hm³. At this level the reservoir is within its normal operating range.
Over the most recent week on record the fill level has held broadly steady (+1.1 pts), and it is 7.1 points below its level on the same date a year earlier.
Across the readings we hold for Churchman Brook — 1065 data points between September 10, 2023 and September 6, 2026 — the level has ranged from a low of 23.8% (August 26, 2024) to a high of 69.4% (December 15, 2025). On average the reservoir is fullest around December and at its lowest around May.
The dam at Churchman Brook was completed in 1928. It is operated by BOM primarily for water supply. It lies within the Churchman Brook Basin basin at 32.153°S, 116.082°E.
Key facts
- Current fill level
- 45.7%
- Water stored
- 1 hm³
- Total capacity
- 2 hm³
- 7-day change
- ▲ 1.1 pts
- Year-on-year
- ▼ 7.1 pts
- Primary use
- Water supply
- River
- Churchman Brook
- River basin
- Churchman Brook Basin
- Year completed
- 1928
- Operator
- BOM
- Coordinates
- 32.153°S, 116.082°E
- Last updated
- September 6, 2026
Recent readings
| Date | Fill level | Volume (hm³) |
|---|---|---|
| 6 Sep 2026 | 45.7% | 1 |
| 5 Sep 2026 | 45.5% | 1 |
| 4 Sep 2026 | 45.3% | 1 |
| 3 Sep 2026 | 45.2% | 1 |
| 2 Sep 2026 | 45.0% | 1 |
| 1 Sep 2026 | 45.0% | 1 |
| 31 Aug 2026 | 44.8% | 1 |
| 30 Aug 2026 | 44.6% | 1 |
| 29 Aug 2026 | 44.4% | 1 |
| 28 Aug 2026 | 44.2% | 1 |
| 27 Aug 2026 | 43.9% | 1 |
| 26 Aug 2026 | 43.5% | 1 |